TL;DR I made a proof of concept using Docker Compose showing dynamic debug logging in the cloud using a structured logging framework. I have examples of more cool logging stuff if you're curious, and finally I talk about the improvements in technical depth.
Dynamic Debug Logging
First, the proof of concept. This is a response to some questions from the Debugging and Observing Your Scala Code talk, where some people were asking how you move the logs around outside of the ELK stack.
Dynamic debug logging is useful in situations where you can't attach a debugger, have multiple services interacting together, or have interactions across multiple threads that don't work well in a debugger because of timeouts. It's good for diagnosis when there's a hard to catch issue, or when you're running experimental features in production.
The code's available on Github.
So here's what dynamic debug logging looks like when you have an application running in the cloud, and you want to have debug logging turned on when the IP address is 127.0.0.1.
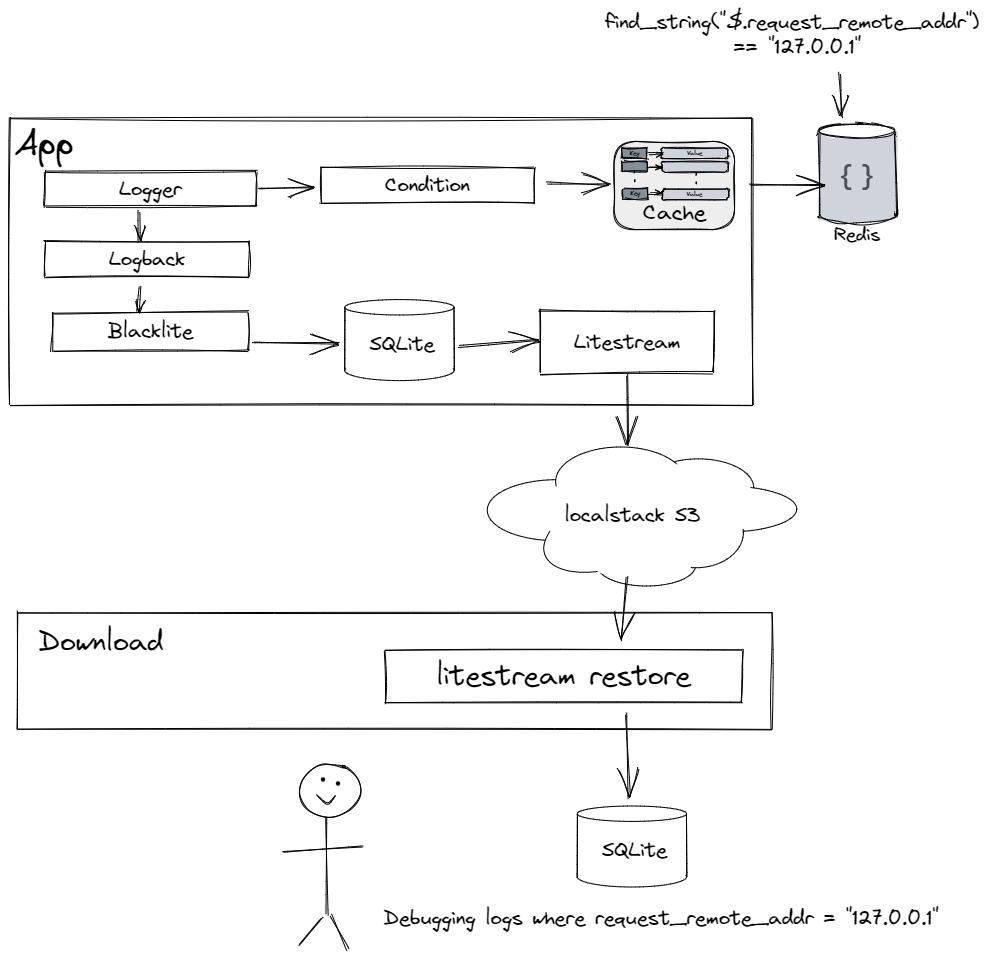
You have an application that has diagnostic (debug / trace) statements layered through it with structured arguments – this could be as simple as key/value pairs, but the point is there's some semantic awareness to the data that gets passed into the debug statements.
Then, on top of the logging framework's criteria for logging (level/package usually) you have a condition that must be met. Conditions can be any arbitrary function returning a boolean, but in this case, conditions are tied to scripts that get passed the structured data and can match or filter on it. The script is stored in a cache, and gets refreshed from an central object store asynchronously when the cache entry is queried after a set duration.
If the condition returns true, the logging statement sends it down to the framework. From there, a logging event is created and passed to an asynchronous appender that writes a log entry in structured format, typically JSON. The appender needs to be able to handle high throughput, but is bounded so only entries from the last hour or so exist – it's debugging data, it doesn't need to hang around for long.
Finally, the logs are replicated or exported from the instance, so that direct access to every instance is not required. Logs do not need to go through the logging pipeline, they can just be dumped into an S3 bucket and analyzed later.
It's important to note that nothing in this stack is technology specific. I'm using Redis, Spring Boot, and Echopraxia here, but you could use an SQL database, Django, and structlog. Same with the embedded scripting language – ideally you want an embeddable scripting language with JIT and sandboxing, but running WebAssembly with JSONPath support would also fulfill the JIT/sandbox needs while leaving the choice of language open. If a scripting language is too much gun, you can also integrate with feature flags.
You should, of course, benchmark this and see what the overhead is with debug enabled, but there is a tremendous amount of outdated folklore surrounding the supposed cost of debug logging. I've written posts on memory allocation pressure and benchmarking so I won't belabor the point, but the short version is that logging is free, logs are expensive. In computational terms, it costs relatively little to set <logger name="com.mycompany" level="DEBUG"> and evaluate potential debug statements in memory compared to writing to disk, which in turn is far less expensive than feeding logs into a centralized logging system. Even if you do see overhead, debug logging is always optional – you can selectively change the logging level at runtime and completely eliminate any evaluation.
There are some extra things like Blacklite and Litestream. I haven't talked much about SQLite recently, but it feels really good coming full circle and seeing the built-in JSONPath matching in json_extract and the new -> and –> operators in 3.38.0. All I can say is that passing structured data logs around as SQLite files feels more useful and natural to me than passing around NDJSON and working with a JSON viewer and command line tools like jq.
Echopraxia Examples
If you're interested in looking more closely at Echopraxia, I now have many examples, enough that I had to break them out into echopraxia-examples.
I always have a hard time with describing use cases, so this should help explain where and when conditions can shine. They are really great in situations where you have to integrate with application code, especially since you can create and pass in conditions as anonymous functions.
For example, the timed diagnostic alerts will automatically trigger logging at debug level when something goes wrong.
Metrics conditions are another good example. Metrics are a perfect example of rapidly changing behavior that could result in logging in some classes but not in others, perfect for conditions. In fact, metrics also work very well as arguments or context in logging, so you can keep a more accurate record of your metrics than you'd be able to do through after the data has gone through centralized metrics aggregation.
There's also a Spring Boot example that demos the AsyncLogger working with thread local variables and caller info.
Working through the examples has been a great learning experience in showing where the API needed more work and proving various ideas. If you want the details, read on.
Technical Improvements
I've been slowly and steadily adding improvements to Echopraxia since my first post, and I'm now at the point I can talk what I've added at least semi-coherently. You've made it this far: this is going to be unabashed technical nerdery.
1.1.0
1.1.0 was two weeks after release. This was kind of a big deal, adding Log4J2, a local directory watching system for script conditions, benchmarking, and changing the way that fields present themselves: simple fields present themselves as value but complex (object / array) fields present as key=value in a line oriented format.
And then… bug fixes. Context fields in particular must be evaluated lazily, and all predicates must check against the logging context against the underlying logging framework, meaning that markers in both Log4J and Logback had to be taken into account. For a variety of edge cases (complex object in particular), I ended up rewriting the JSON serialization in 1.1.3, removing the conversion to logstash-logback-encoder markers for fields and values, and adding an EchopraxiaModule directly.
1.2.0
In 1.2.0, I did my best to make the API more robust against null, and provide some reasonable behavior for Echopraxia if null did exist so that logging could continue or at least provide a comprehensible error message. I did some small optimizations like short-circuiting on Condition.never operations and using a thread local string builder where I could get away with it. And I added asynchronous logging, so all condition evaluation and logging would take place in a background thread – a bit awkward in some cases given that the logging event's timestamp wouldn't accurately reflect when the method was called, but you can automatically add a timestamp in using a custom logger if it matters.
1.3.0
1.3.0 started with the realization that async logging is tricky.
Caller info is what happens when a logging statement wants to include information about what method and file it came from. Log4J and Logback handle it in subtly different ways, but the basic premise is that an exception is created and then compared against a string to filter against the stack trace elements.
Async logging broke caller info because the exception was being created in the background thread, and I needed to create it outside and pass it in by hand. This was a bit complicated. It is faster to process the throwable asynchronously, but I had to add a CallerDataAppender wrapper and a echopraxia.async.caller flag to make it all work. It's an edge case, but given that part of the reason that caller info is so rarely used is because it's expensive, it's nice to have something that removes the cost.
At the same time, I was experimenting more with adding conditions to loggers and wanted a way to add conditions or fields to all loggers transparently, without having to do LoggerFactory.getLogger().withCondition(). This is where having a distinction between the user level loggers and the core logger made it easy – I could add filters using a CoreLoggerProvider, and return a CoreLogger that was already preconfigured.
I wanted to make building custom loggers easier. The Logger and AsyncLogger methods are really just wrappers around CoreLogger, and there's also fluent and semantic loggers. It should be easy to create domain specific loggers mix and match, that do more than just plain info or debug statements and enable domain oriented observability and the "Logging Is a Feature" section in Growing Object-Oriented Software Guided by Tests. Java programmers should also not have to deal with parameterized loggers – managing Logger<?> is still pretty ugly – so providing multiple options was important.
This took a while to get right, and I ended up digging into AssertJ to steal some tricks. Using inheritance directly was awkward, so I broke down the code into an AbstractLoggerSupport that had the basic with methods, and then the logger methods themselves were defined with DefaultLoggerMethods defined on the interface. Unfortunately, it's still far too easy to mess up the caller info with custom methods, but custom logger factories are compact enough that end users should feel comfortable building their own.
Finally, as I made more and more use of the API, I belatedly realized that argument fields should be available in conditions. If the level is INFO, there are no arguments computed, so the overhead is still small, but if the level is DEBUG and everything depends on conditions, then conditions need to have information available at the statement level. The key was realizing that a condition will execute based off the context – but the context could also include arguments, either positively or negatively. For example, a condition may return true unless a specific argument is present or has a certain value.
All of that made it into 1.3.0. It was a lot.
1.4.0
For 1.4.0, there was really only one main feature: JSONPath. JSONPath is a DSL for reading JSON documents, and when conditions rely on matching on fields and checking specific values, it became pretty clear that using the Stream API to do Condition.anyMatch(f -> f.name() == "name") was less fun than something like this:
Optional<String> optName = context.findString("$.name");
I'd love to claim hard work, but really, implementing an EchopraxiaJsonProvider and adding mapping turned out to be surprisingly easy thanks to Jayway's design. There a couple of moments where I was confused, but there was never a point where I had to fight to get something to work.
Even better, I found that I could leverage JSONPath to match on exceptions! Being able to define $.exception.cause.message or $.exception.stackTrace[0].methodName is one of those small joyous moments where a new feature just dropped into my lap.
Adding JSONPath really closed the loop in another way. Blindsight, the Scala Logging API, allows for structured logging, but does not require it. It does have a CoreLogger, but CoreLogger takes an SLF4J logger internally. Echopraxia is not like that – it's based entirely around fields and structured data, the CoreLogger is SPI based, and there is no dependency on SLF4J at all. When I wrote Blindsight, I was still figuring out what I wanted, and in Echopraxia I already knew. It's remarkable to see how adding a requirement at the beginning can open up the design space later on.
The next step was working JSONPath into Tweakflow. This required a bit more digging, and the ultimate decision to just completely wipe the interface into scripts.
Before, scripts looked like this, where the ctx was a raw dictionary of fields:
library echopraxia {
  function evaluate: (string level, dict ctx) ->
    str.lower_case(ctx[:person][:name]) == "will";
}
To make JSONPath work in scripts, I had to break this functionality and instead pass a dictionary of user functions:
library echopraxia {
  function evaluate: (string level, dict ctx) ->
    {
      let find_string: ctx[:find_string]
    }
    str.lower_case(find_string("$.person.name")) == "will";
}
and provide access to the raw fields as a fallback:
library echopraxia {
  function evaluate: (string level, dict ctx) ->
    let {
      fields: ctx[:fields]();
    }
    fields[:person][:name] = "Will";
}
This gets scripts to the point where I'm mostly happy with them. I'm not thrilled that level is a string rather than an enum, but given that level checks happen before conditions, I don't think it's a huge problem that you have to check them all individually rather than doing isGreaterThan, and a custom library would probably work.
The other quality of life feature in 1.4.0 is withThreadLocal, which sets the scene for when the async logger has context fields that rely on a ThreadLocal and need to be set up. For example, Spring Boot relies on a thread-local RequestAttributes, so we can copy that over to the logging thread as follows:
private final AsyncLogger<?> asyncLogger = AsyncLoggerFactory.getLogger()
  .withFieldBuilder(HttpRequestFieldBuilder.class)
  .withThreadLocal(() -> {
    // get the request attributes in rendering thread...
    final RequestAttributes requestAttributes = RequestContextHolder.currentRequestAttributes();
    // ...and the "set" in the runnable will be called in the logging executor's thread
    return () -> RequestContextHolder.setRequestAttributes(requestAttributes);
  }).withFields(fb -> fb.requestFields(httpServletRequest()));
The example shows a raw AsyncLogger<?>, but my sincere hope is that end users never see this functionality in their controller code, as it gets packaged into a custom logger for the application.
Next Steps
The next steps for Echopraxia are creating a Scala API for Echopraxia, and providing Echopraxia as a backend for Blindsight. This is going to be really fun technically, as it means that Echopraxia will be able to leverage macro inspections and flow logging, making diagnostic logging considerably less manual.
Comments