The last blog post talked lots about Logging vs Memory with an emphasis on memory allocation, and discussed some possible improvements. However, I didn't run this through with an actual application. That's what this blog post is about.
TL;DR JDK 11 is better in some counter-intuitive ways. If you are still using JDK 1.8, you can reap some significant performance improvements and reduce memory allocation rates just by recompiling and running with a more recent version of the JDK.
I've saved all the GC logs and gatling tests in the results directory so you can run gcloganalyzer or gcplot, and included inline links as well.
Load Testing Framework
My usual load test tool is Gatling, which is very good at nailing down complex scenarios and running various complex feeds and random feeds. There are various tutorials and guides and you can run it with CI using Taurus.
I recommend downloading the stand alone version and running a script from the simulations directory.
The goal here is to have some sustained requests rather than some crazy amount of load, so we fire up 500 concurrent users over 500 seconds with 500 requests each:
class GatlingSpec extends Simulation {

  val httpConf: HttpProtocolBuilder = http
    .baseUrl("http://localhost:9000")
    .userAgentHeader("Mozilla/5.0 (Macintosh; Intel Mac OS X 10.8; rv:16.0) Gecko/20100101 Firefox/16.0")

  val indexReq = repeat(500) {
    exec(
      http("Index").get("/").check(status.is(200))
    )
  }

  val readClientsScenario = scenario("Clients").exec(indexReq).pause(1)

  setUp(
    readClientsScenario.inject(rampUsers(500).during(500 seconds)).protocols(httpConf)
  )
}
It's not very sophisticated, but it doesn't need to be. I'm running this on a laptop, with both Gatling and the app on the same hardware, so a stress test would be minimally accurate in any case.
Application
I ran this play application using the following JVM options, using sbt stage to create a production version of Play:
For the logging, I set up logback.xml with the following:
<configuration>

  <shutdownHook class="ch.qos.logback.core.hook.DelayingShutdownHook"/>

  <conversionRule conversionWord="coloredLevel" converterClass="play.api.libs.logback.ColoredLevel" />

  <!-- only log warn and error to STDOUT -->
  <appender name="STDOUT" class="ch.qos.logback.core.ConsoleAppender">
    <filter class="ch.qos.logback.classic.filter.ThresholdFilter">
      <level>WARN</level>
    </filter>
    <encoder>
      <pattern>%coloredLevel %logger{15} - %message%n%xException{10}</pattern>
    </encoder>
  </appender>

  <appender name="ASYNCJSON" class="net.logstash.logback.appender.LoggingEventAsyncDisruptorAppender">
    <ringBufferSize>32768</ringBufferSize>
    <listener class="net.logstash.logback.appender.listener.FailureSummaryLoggingAppenderListener"/>
    <appender class="ch.qos.logback.core.FileAppender">
      <file>logs/application.json</file>
      <append>false</append>
      <immediateFlush>false</immediateFlush>
      <encoder class="net.logstash.logback.encoder.LoggingEventCompositeJsonEncoder">
        <providers>
          <timestamp/>
          <logLevel/>
          <loggerName/>
          <threadName/>
          <message/>
          <logstashMarkers/>
          <arguments/>
          <stackTrace/>
        </providers>
      </encoder>
    </appender>
  </appender>

  <root level="TRACE">
    <appender-ref ref="ASYNCJSON" />
    <appender-ref ref="STDOUT" />
  </root>

</configuration>
As you can see, there are no surprises here. I bumped up the ring buffer size and added a listener just in case.
JDK 14 with Shenandoah
The first thing I tried was the ideal use case: JDK 14 using Shenandoah.
/home/wsargent/.jabba/jdk/[email protected]/bin/java
-Duser.dir=/home/wsargent/work/memalloctest/target/universal/stage
-Dpidfile.path=/dev/null
-Dplay.http.secret.key=a-long-secret-to-defeat-entropy
-Xlog:gc*,gc+age=debug,gc+heap=debug,gc+promotion=debug,safepoint:file=/home/wsargent/work/memalloctest/target/universal/stage/bin/../logs/gc.log:utctime,pid,tags:filecount=10,filesize=1m
-Xms4G
-Xmx4G
-XX:MaxInlineLevel=18
-XX:MaxInlineSize=270
-XX:MaxTrivialSize=12
-XX:-UseBiasedLocking
-XX:+AlwaysPreTouch
-XX:+UseNUMA
-XX:+UnlockExperimentalVMOptions
-XX:+UseShenandoahGC
-XX:-ShenandoahPacing
-XX:ShenandoahGCHeuristics=compact
The settings here are for web applications specifically here: the compact setting runs GC cycles continuously providing prompt space reclaimation. Pacing is disabled as it adds extra latency, and isn't relevant with compact anyway.
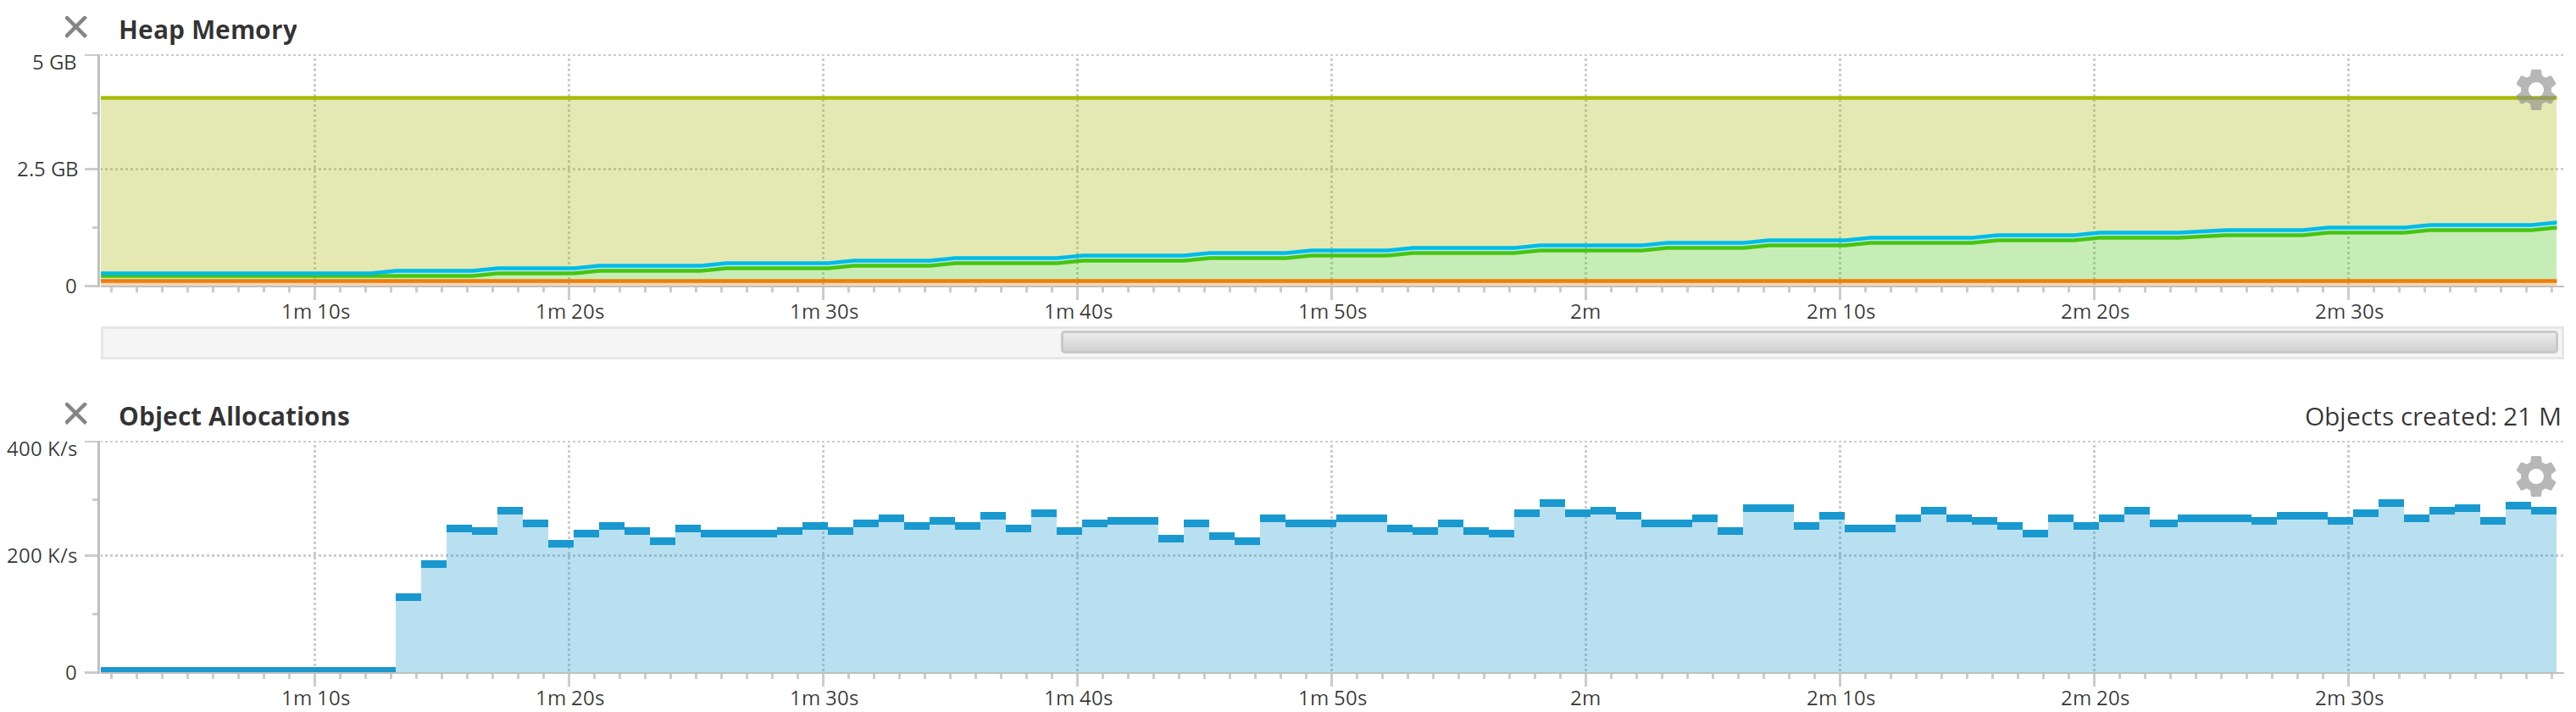
Initially, I was interested in seeing how Shenandoah's GC interacts with high memory allocation rates, and compare it to the premature tenuring in G1GC under high memory allocation rates. I had trouble using GC logs with gceasy.io, but was able to verify the object allocation rate with Yourkit 2020.7, using the object allocation count recording.
This works great! The CPU runs at around 35%, split evenly over all cores, but that's Gatling.
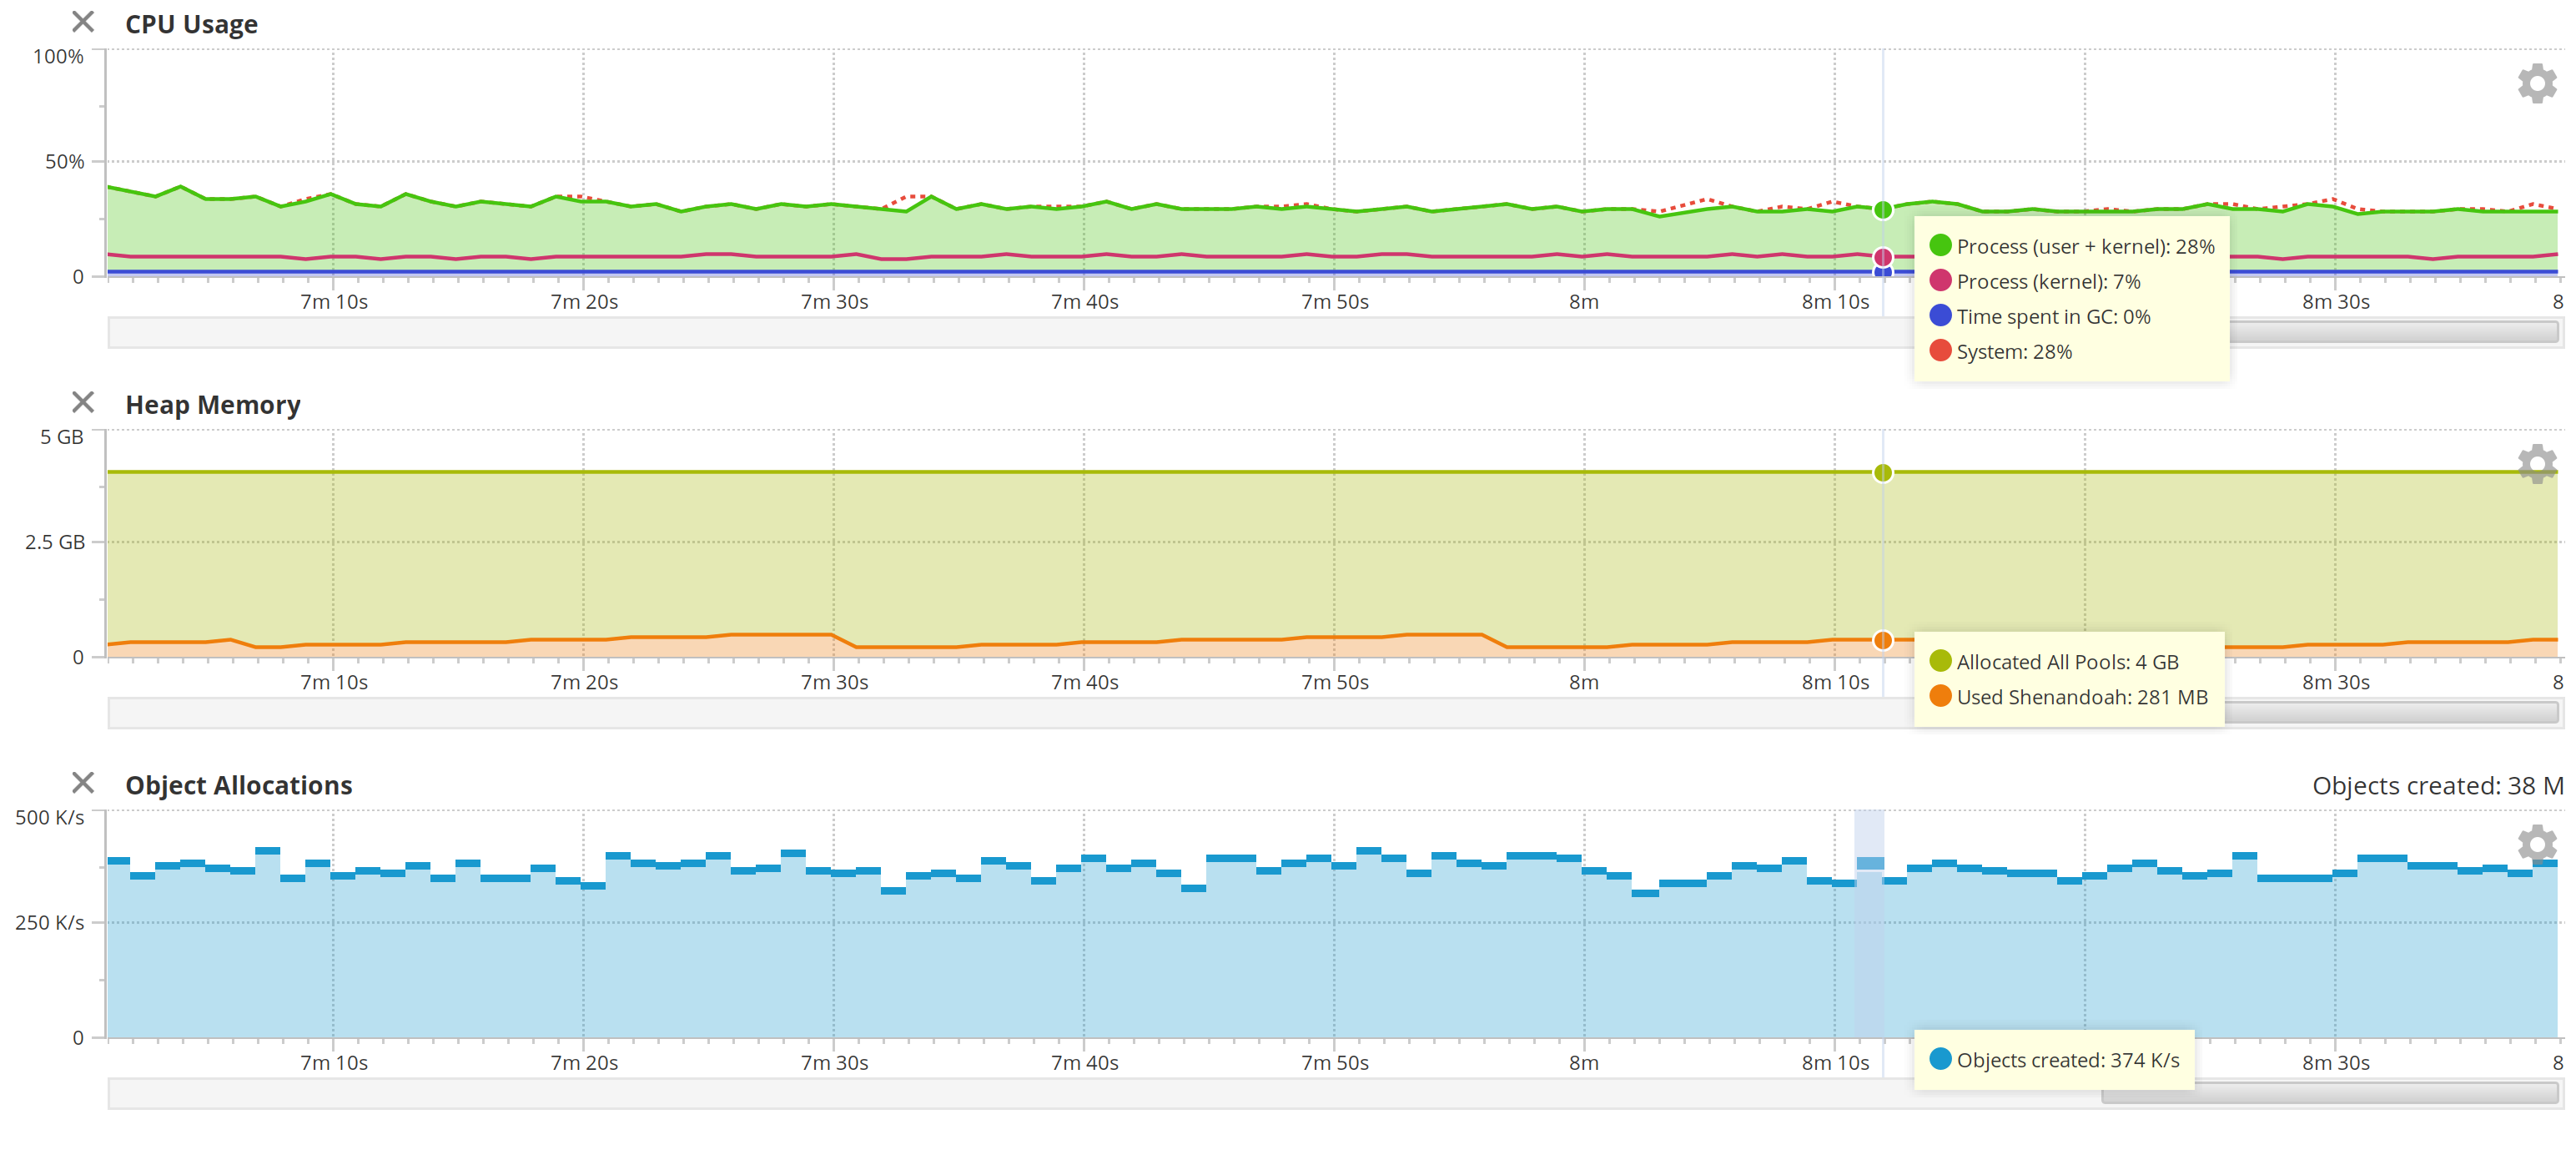
But look at those allocation rates. Look at that heap.
When I ran with INFO at the root level, the mean rate was 350 K/s, with the highest allocation rate was 419 K/s.
When I turn on DEBUG at the root level, the allocation rate is around 350 K/s.
When I turn on TRACE at the root level, the allocation rate is still between 350 K/s and 400 K/s.
I worried at first that I was dropping DEBUG and TRACE statements from the async appender as the queue filled up. But no: adding a FailureSummaryLoggingAppenderListener did not result in a warning, and the JSON file was full of tracing statements. The application as a whole was also in good shape: the vast majority of HTTP responses completed in less than 5 milliseconds. The CPU wasn't breaking a sweat. There were just way fewer allocations than I expected.
Here's the GC logs and Gatling load test results for reference:
So even without running a heavy load test, I learned some things that run counter to my intuition. The next question is how much of this is real.
JDK 1.8 with G1GC
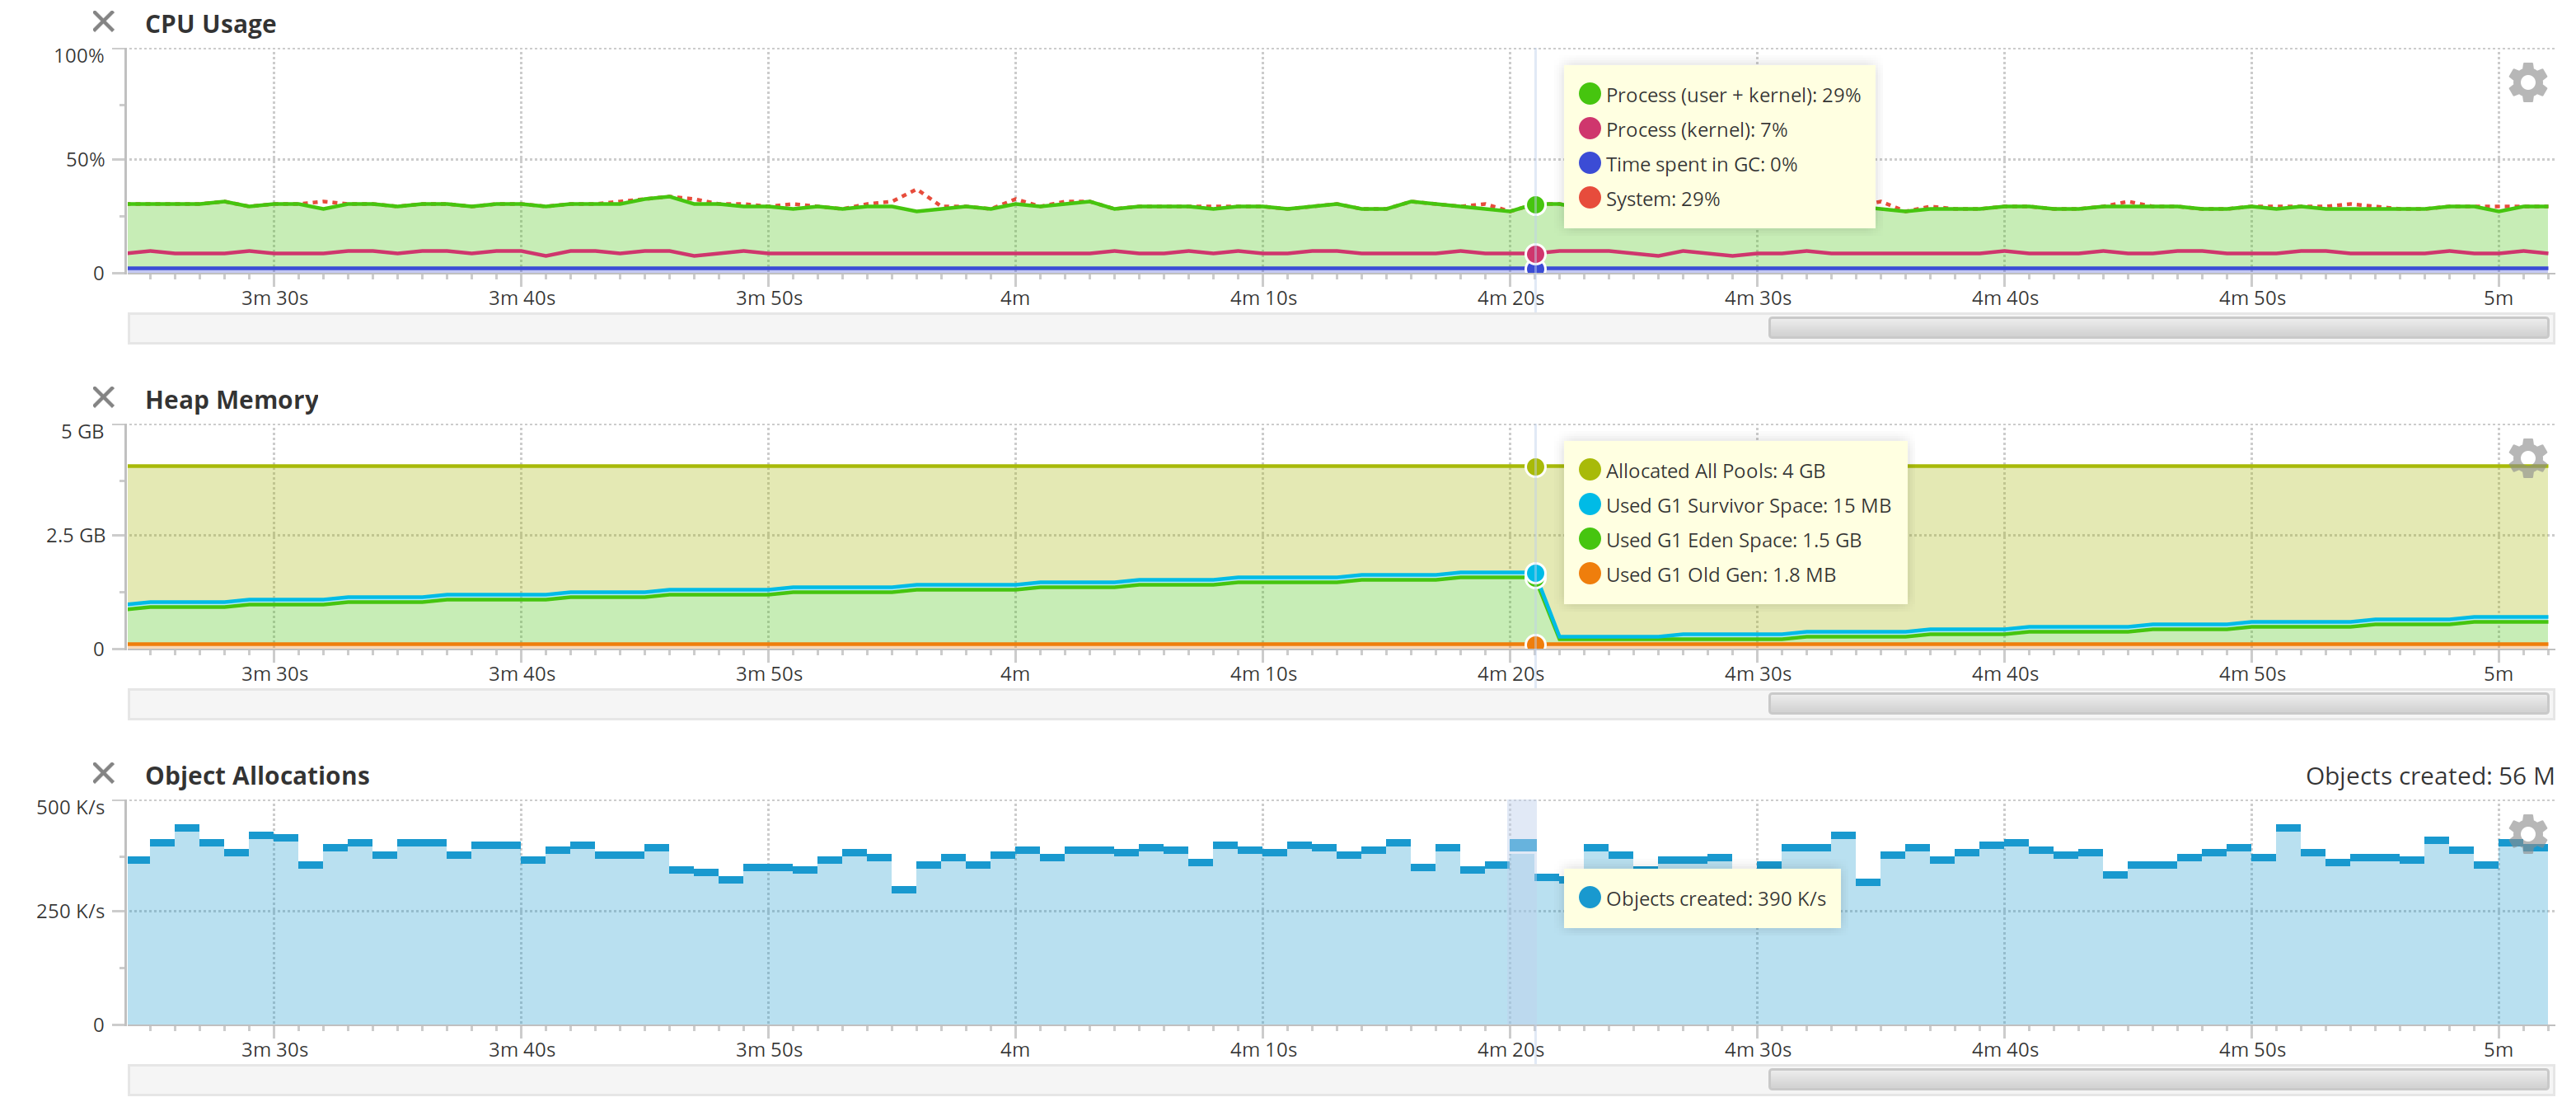
Repeating the exact same experiment with JDK 1.8 and G1GC, using TRACE level:
/home/wsargent/.jabba/jdk/[email protected]/bin/java
-Duser.dir=/home/wsargent/work/memalloctest/target/universal/stage
-Dpidfile.path=/dev/null
-Dplay.http.secret.key=a-long-secret-to-defeat-entropy
-Xms4G
-Xmx4G
-XX:MaxInlineLevel=18
-XX:MaxInlineSize=270
-XX:MaxTrivialSize=12
-XX:-UseBiasedLocking
-XX:+AlwaysPreTouch
-XX:+UseNUMA
-XX:+UseG1GC
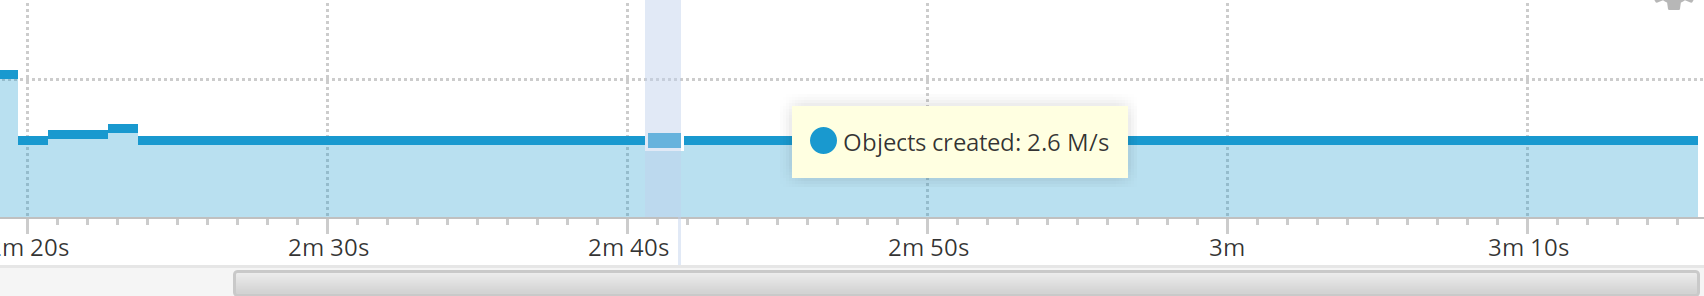
Ah-ha. The allocation rate is 2.6 M/s. This is still way below the limits of what the JVM is capable of, but more in line with what I'd expect.
In addition, G1GC took up to 2.5 GB of heap before collapsing again, as opposed to Shenandoah which barely took up 512 MB.
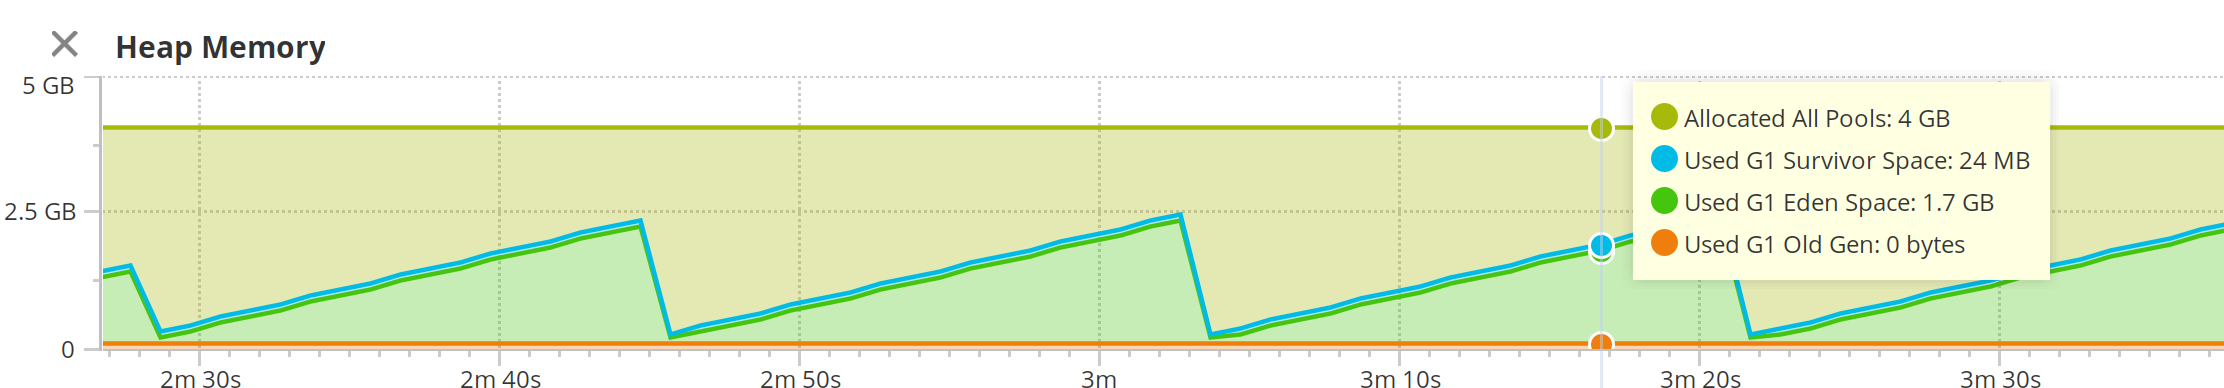
The average duration of GC pauses was 655 ms, as opposed to 5ms with Shenandoah.
I tried running it with INFO. Interestingly, I saw around 1000 allocations per second under JDK 1.8 when idle. In JDK 11, the idle allocation rate was 761/s. In JDK 14, it was 351/s.
When I ran logging at INFO level, I was still seeing an allocation rate of 2.5 M/s. So, logging is not a significant source of memory allocation here; most of the garbage is in the framework itself, processing HTTP requests.
Results for TRACE GC logs under 1.8:
I'm not sure why the CPU doesn't show Gatling in the Yourkit view, but it shows under htop. I think it's just 1.8 not having as much info.
Next up – run JDK 11 with G1GC.
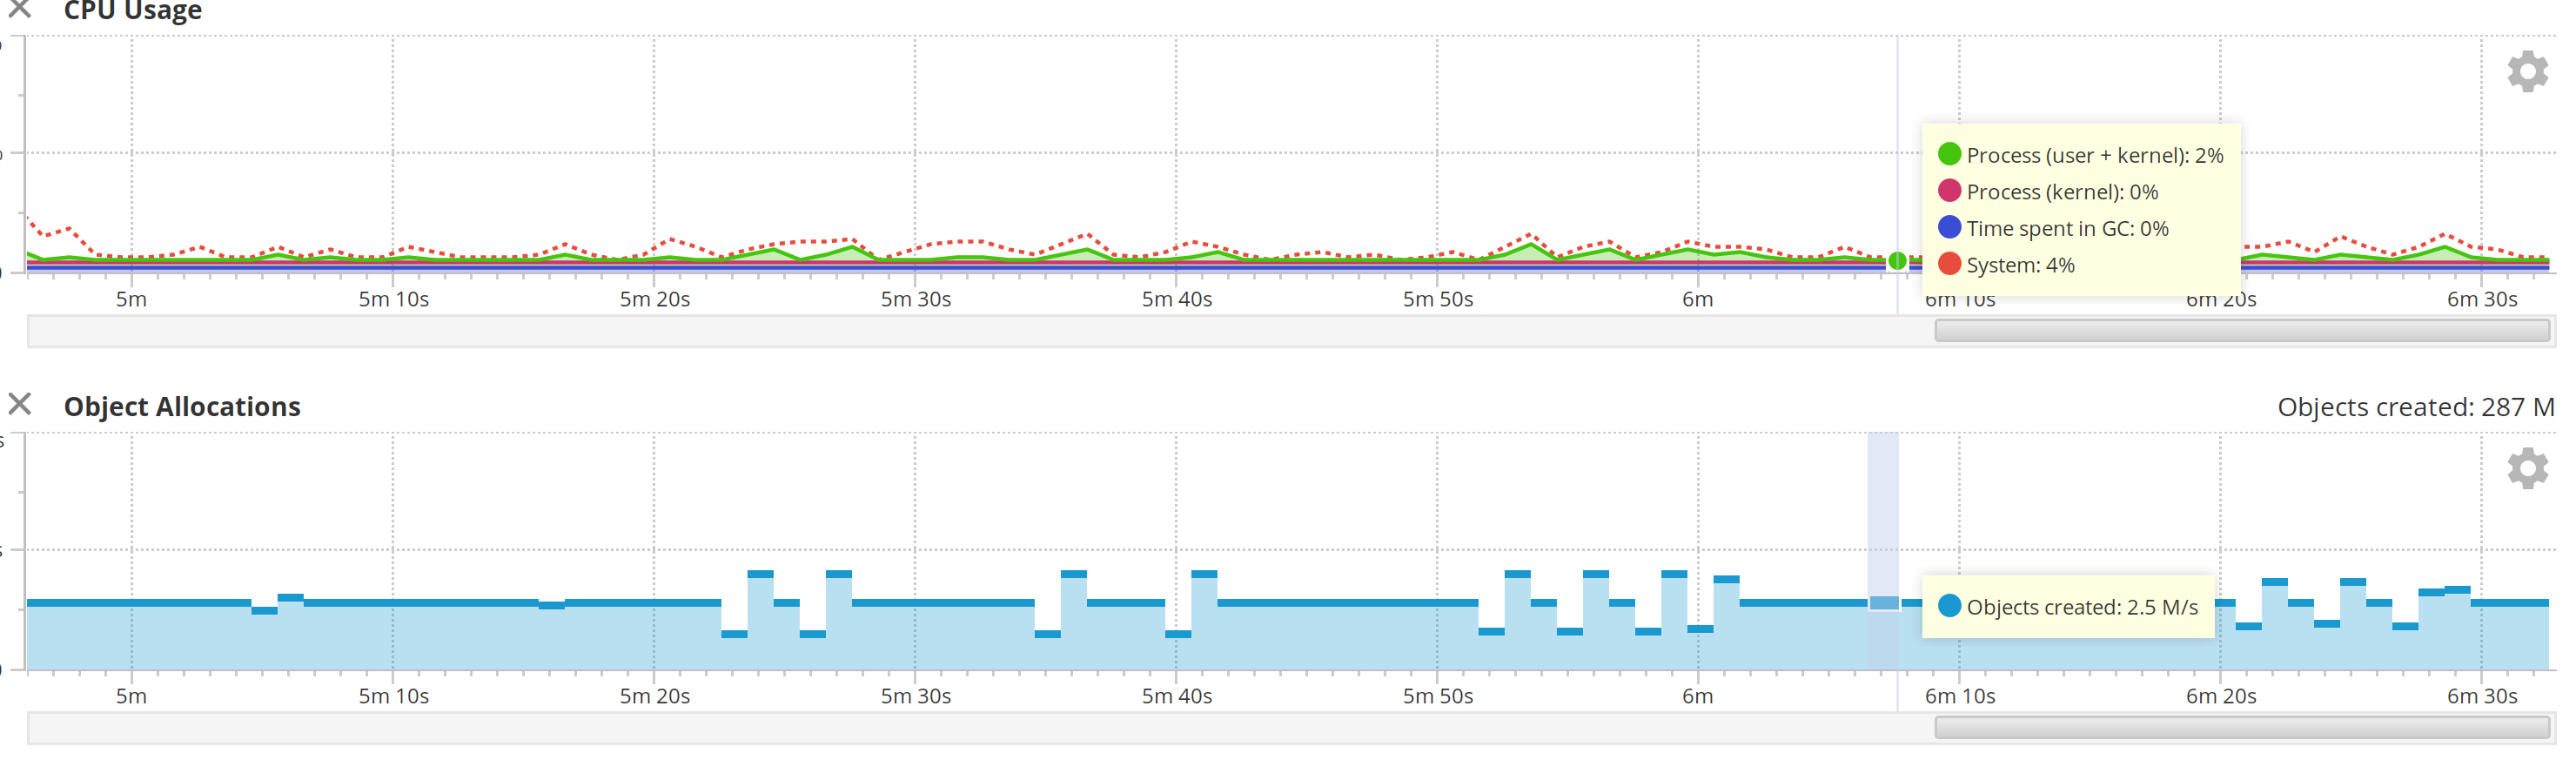
JDK 11 with G1GC
Let's try JDK 11 with TRACE logging, but running with G1GC. This should at least give us an apple-to-apples comparison between 1.8 and 11.
I recompiled the codebase using JDK 11 as well as running it, because I suspected it might be string concatenation improvements which can be affected by compilation.
Interesting. Same results. Whatever the improvement is, it's in JDK 11, not related to JDK 14 or G1GC.
Now let's try JDK 14 with G1GC.
JDK 14 with G1GC
Same results as JDK 11.
The allocation rate was the same – around 300 K/s or even lower than that. I sometimes saw it dip down to 276 K/s. You can see how slowly the heap grows compared to 1.8.
Whatever it is that causes allocation rates to drop, it's not the garbage collector – it's something else. It could be the improvements in string concatenation added in JDK 1.9, or it could be improvements to the JIT compiler.
Because JDK 14 comes with Graal's JVMCI compiler included, we can turn that on as well and see if scalar replacement helps any. I did not see much of a difference between JVMCI and C2 here.
We Don't Have To Do Zero Allocation
The advancement of garbage collection in newer JVMs means that there does not need to be as much focus on garbage-free and frugal memory techniques as there has been in the past. As Martin Thompson says in Evolution of Financial Exchange Architectures:
Garbage collection is one of the systemic events. That was the big one that most people started to realize. You run on something like parallel old in Java, or most of the various garbage collectors in C#, and you get these huge pauses. CMS was probably the better choice in finance for a long time, but it still had these full GCs that were nasty, and stop-the-world. People went with one of two approaches, either a huge memory space, and you just hoped and prayed that you didn't get in an event that was nasty before the end of the trading day. At the end of the trading day, you triggered a full GC and you cope with it. Or, you just write-no-allocate in your application. Those are the major approaches people took.
Then things start to change. People discovered C4, the Azul's Zing, concurrently compacting collector, which was just revolutionary, where we could run at high allocation rates, and not get really nasty GC pauses. Part of the history of that is that was originally designed for the Vega CPU where you're looking at up to 1000 CPU cores. Things like Amdahl's law was in your face all of the time. Stop-the-world events really got to hurt you. They're designed to cope with this and have a very responsive system. That's changed things a lot. The nice thing is it's inspired other things going forward. We've got GC Shenandoah. G1, just ignore in this space because it still is not really a proper concurrent collector. That's since C4 leads the way. ZGC is very much inspired by it but running way behind. It's not generational. It's got various other issues. Shenandoah is looking nice, especially on smaller heaps. We're getting progress in this area. It's changing how we think about this. We don't have to do zero allocation, like we did in the past. [emphasis added]
Conclusions
I knew that I'd see improvements with newer GCs, but the improvements here are such that I'm still taking stock.
Clearly it's entirely possible to log an application at TRACE using the newer JVMs without impacting your CPU or GC. There's a lot you can do with that.
Note that you are still dependent on the IO bandwidth of your disk drive. This load test didn't stress the NVMe SSD drive in the laptop, but cloud instances typically have around 250MB/sec of IO. However, it's entirely possible to set up a tmpfs volume with 1 GB, and write all debugging and trace information to memory – a c5 large instance has 8 GB going free, and Shenandoah means you can run a Play application in 512 MB and still have headroom.
Comments