I've talked about logging with ring buffers before, in Triggering Diagnostic Logging on Exception. The basic idea is that you log DEBUG and TRACE statements to some in-memory data store, and only keep the last 1000 records. If there's an exception, you dump those records to the persistent logs so you can debug what led up to the exception.
At that time, it was still pretty rough. I was still hampered by the append-only nature of files, and so I put the stored diagnostic logging into a nested JSON field. I also didn't have a good way to query and filter on records so that only relevant contextual diagnostic information made it into the event.
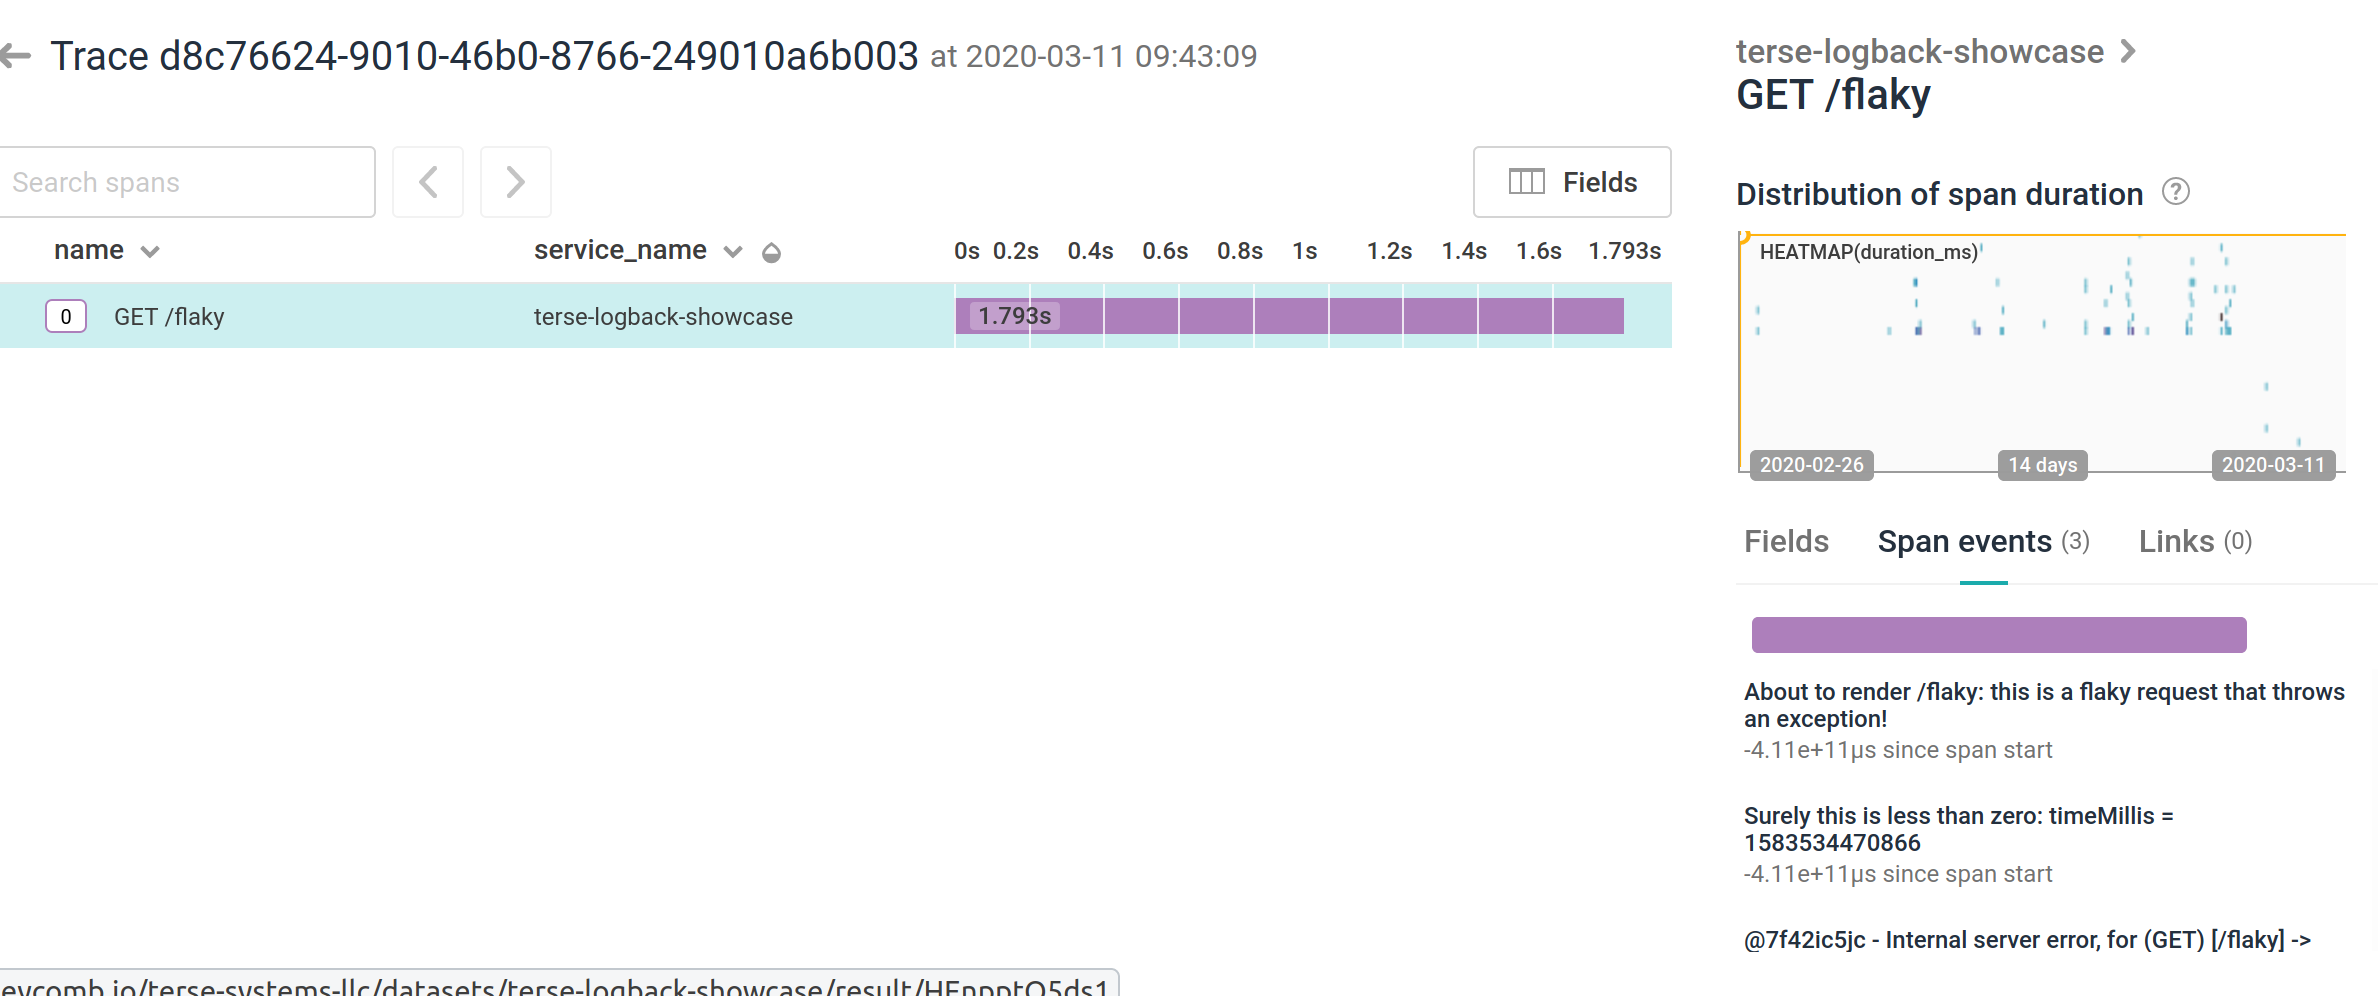
I'm happy to say that those problems are solved, and I've got a showcase application that dumps records to an in-memory SQL database on exception, then queries the database for records with a correlation id. On top of that, it also integrates with Sentry and Honeycomb to display the diagnostic statements as breadcrumbs or traces, respectively. I am calling the "dumping of ring buffer traces" feature "backtrace" because TRACE statements can go away and then come back. I think this is safe – I don't think anyone's used "backtrace" and "stacktrace" as synonyms for years now, and I think this makes more sense anyway. (I did find a support article from Veritas that also uses this terminology, and spdlog also uses this terminology, so I am vindicated.)
As an example, I've got two screenshots here, one showing a trace with diagnostic information rendered as span events:
and another one showing diagnostic logging as just plain spans:
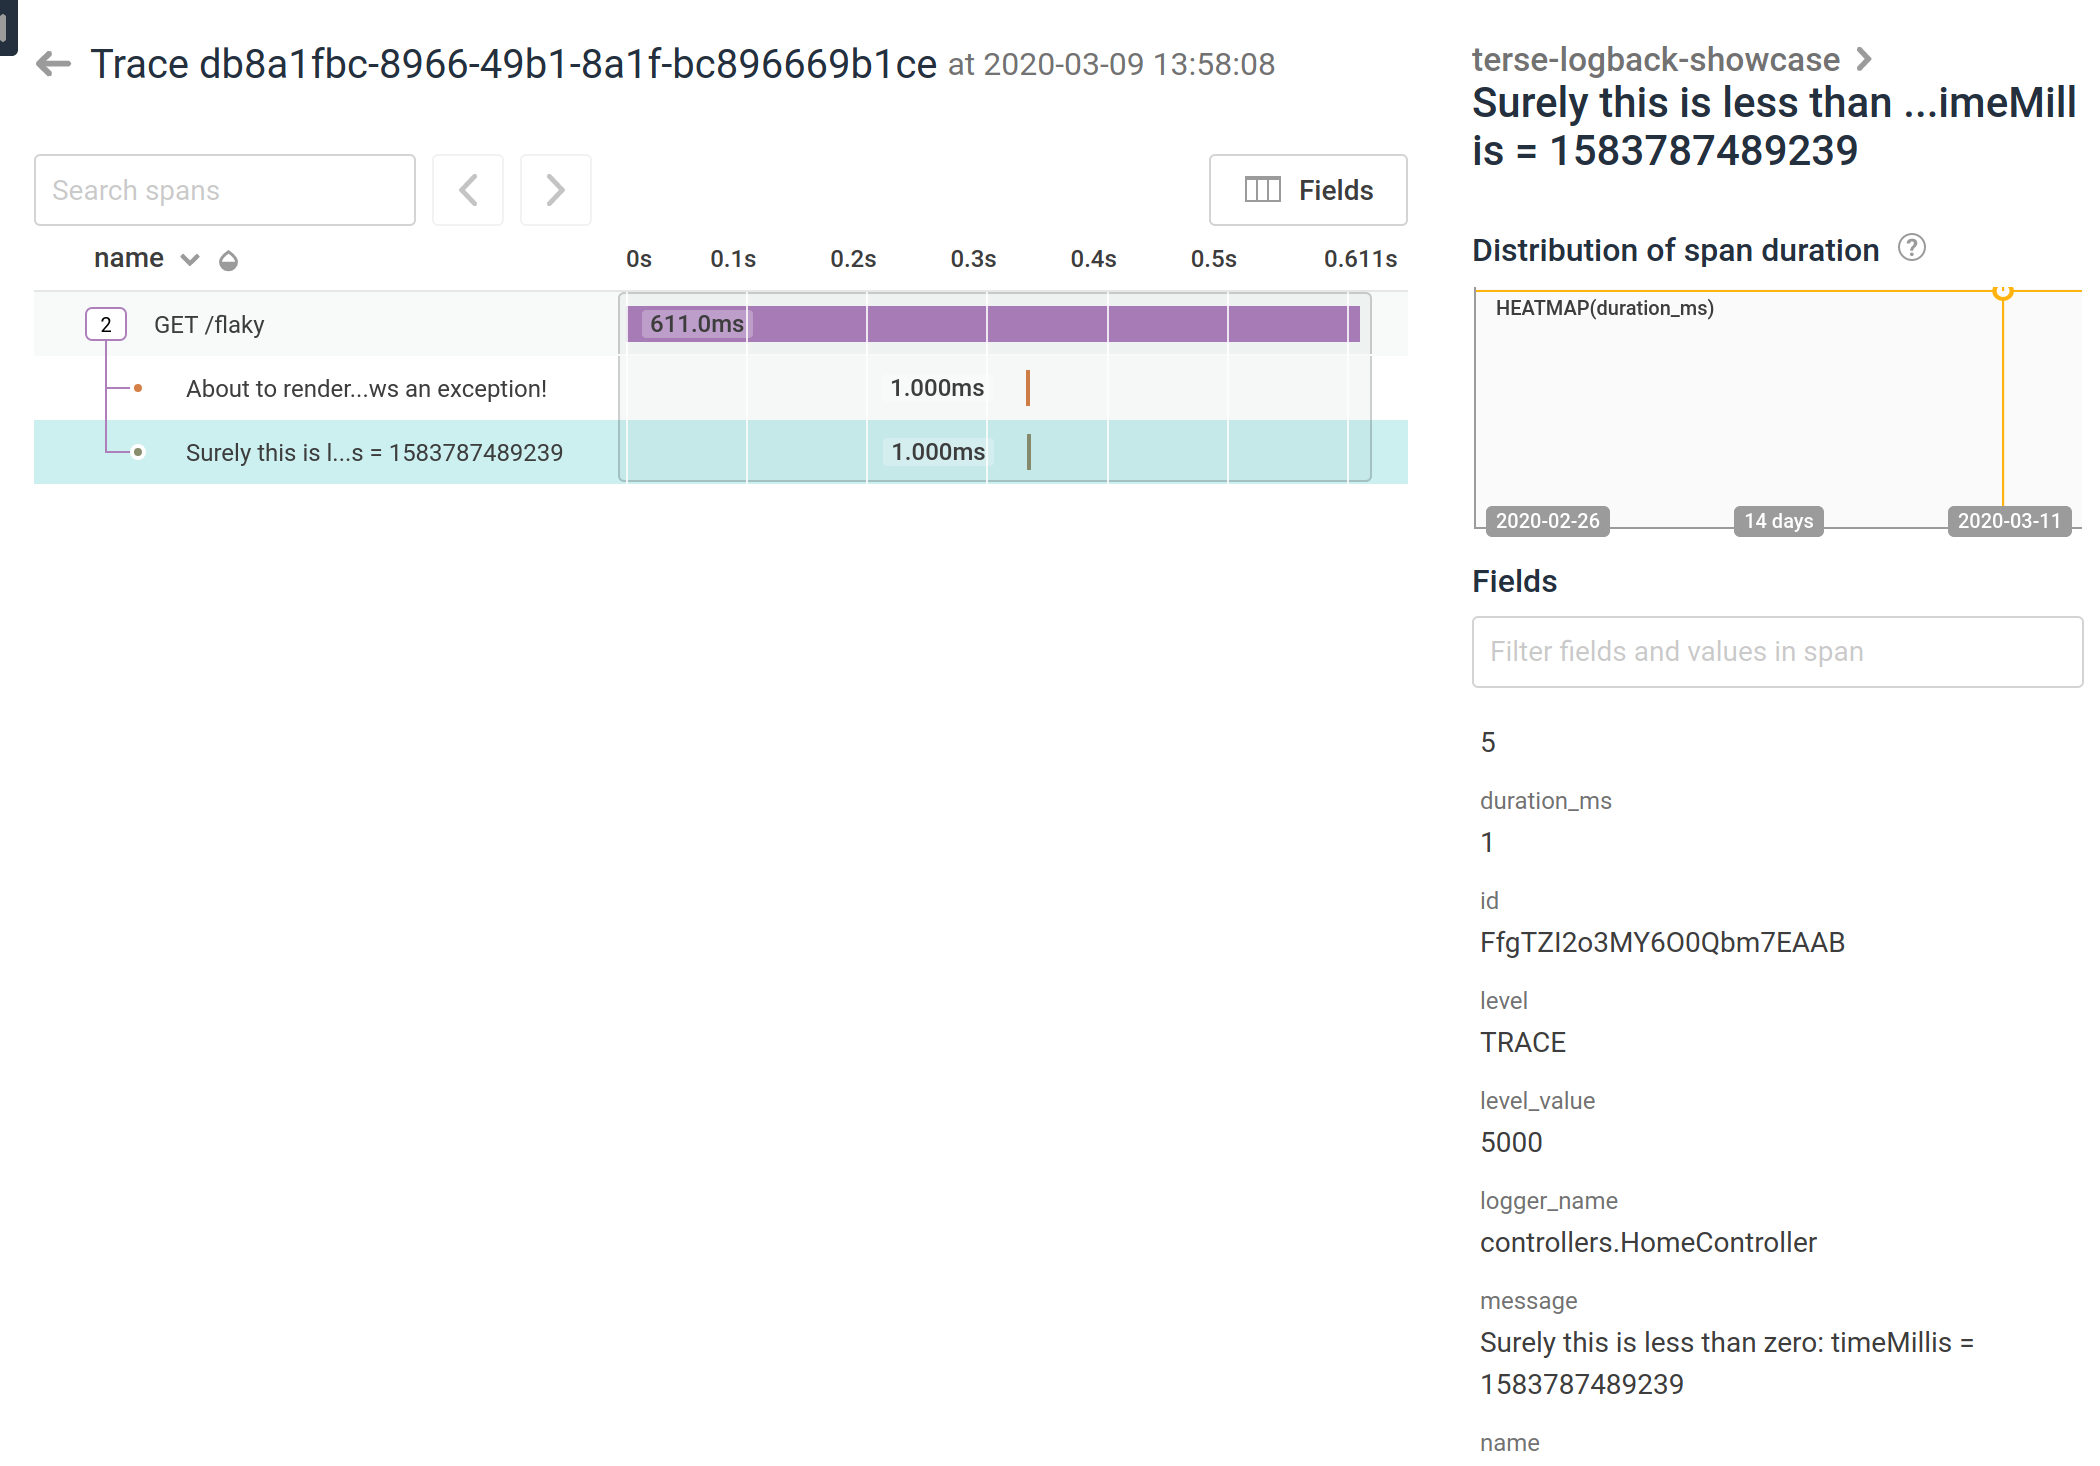
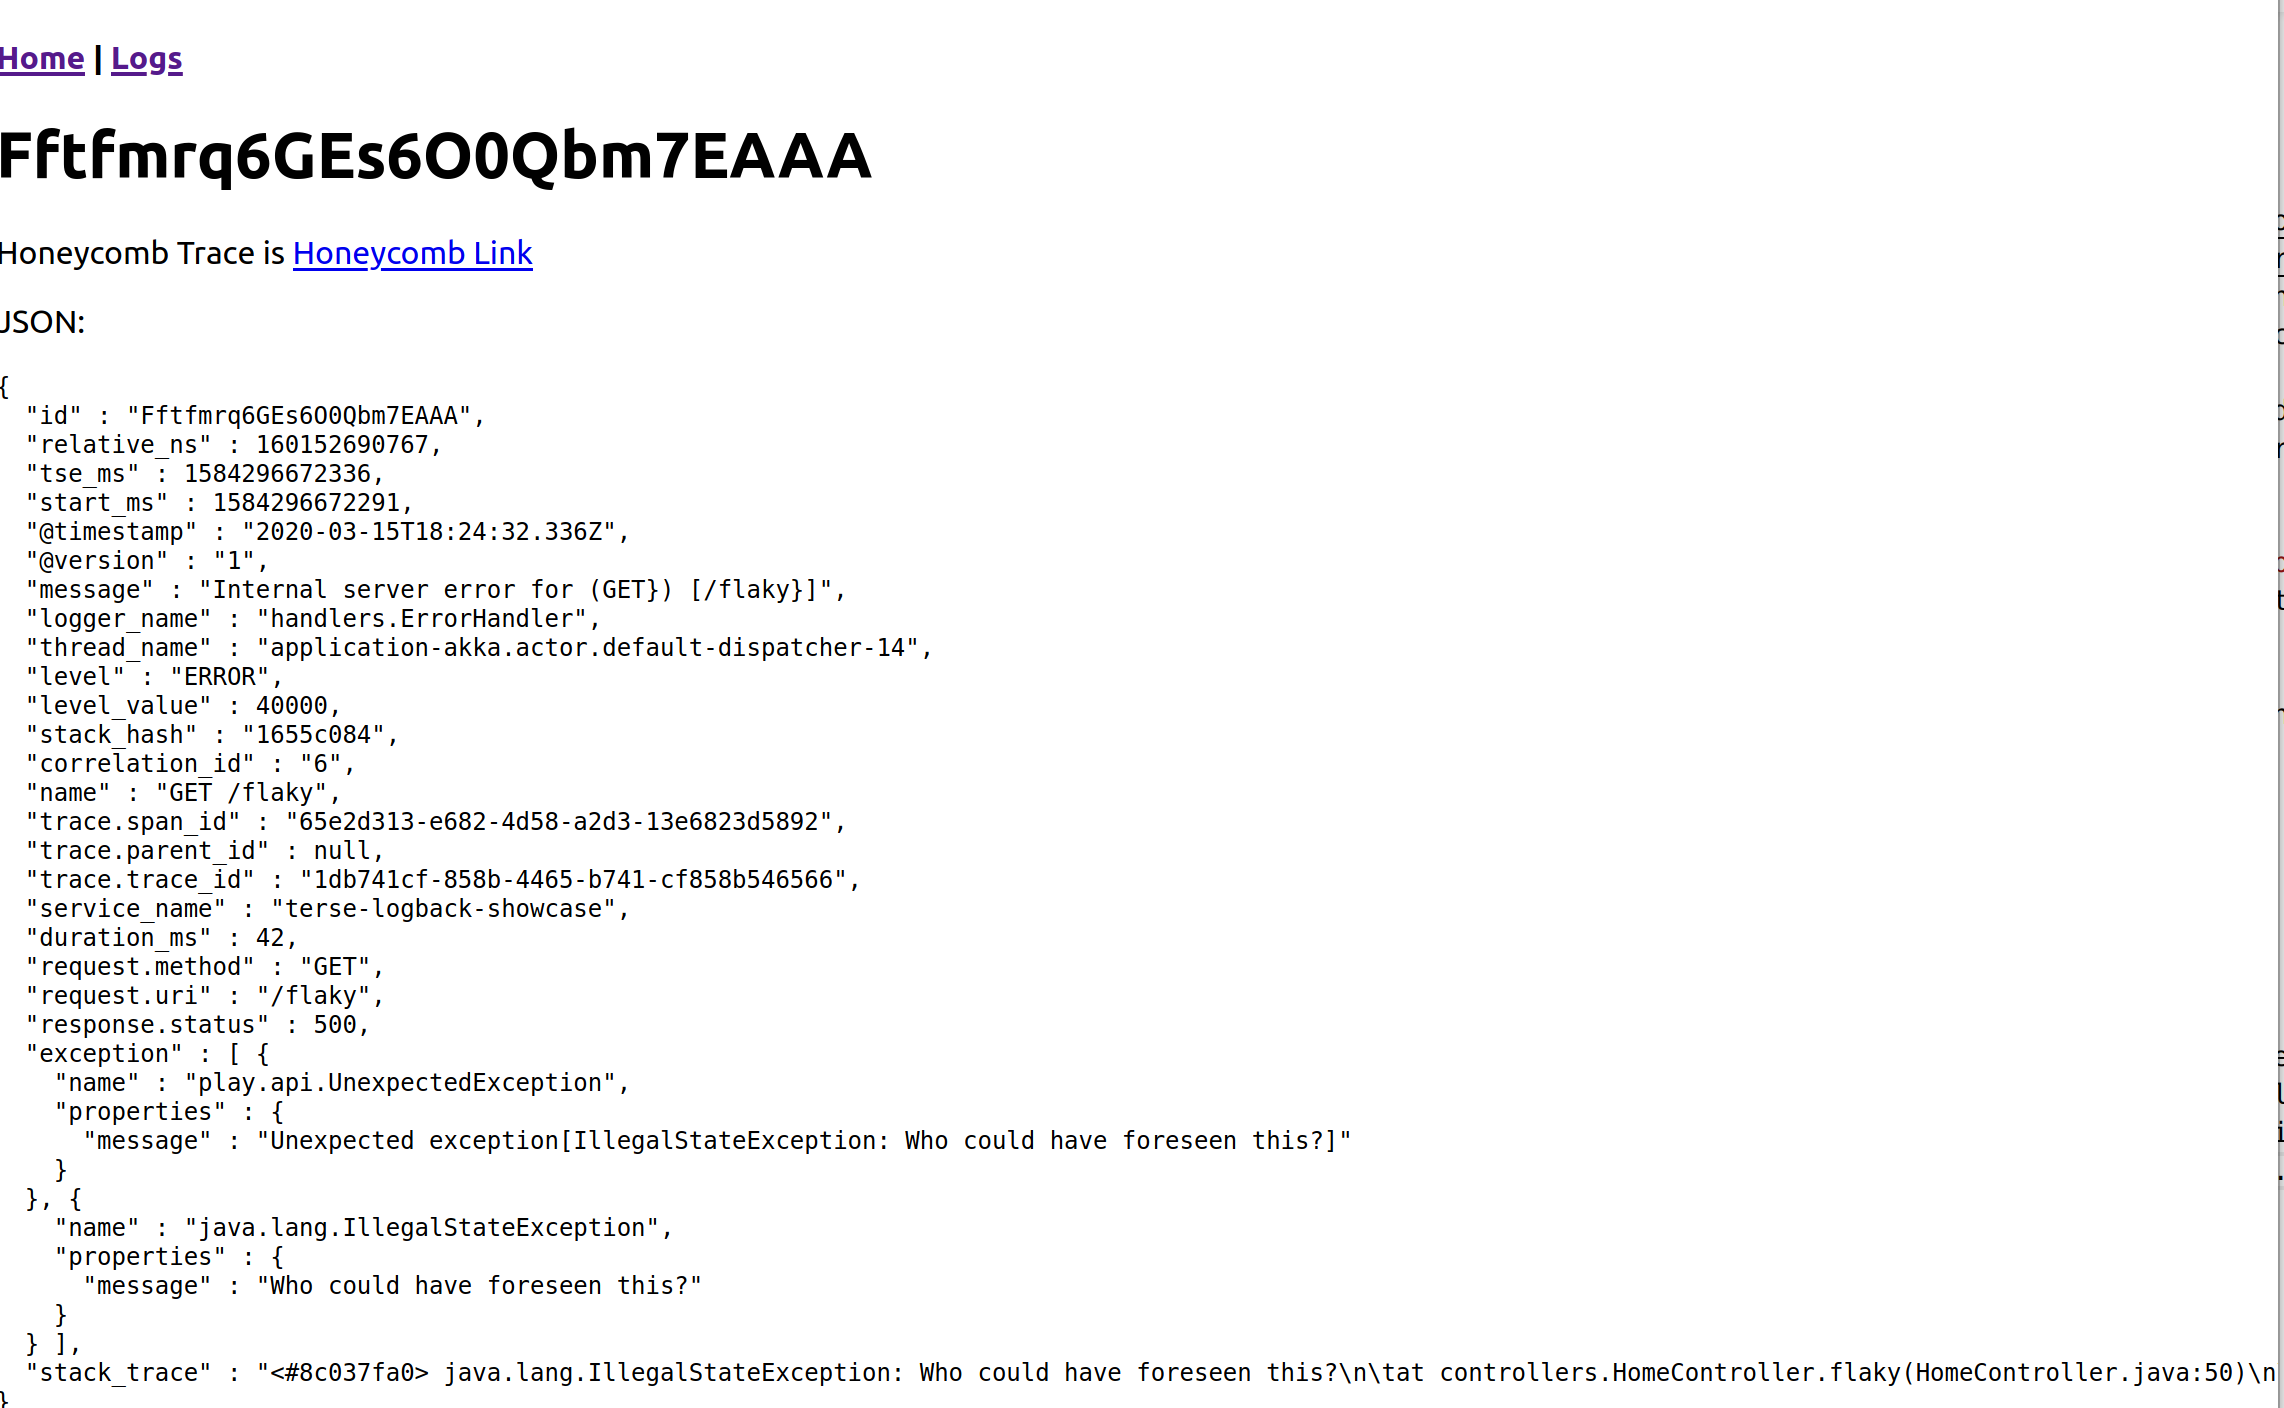
On top of that… because it's an SQL database, I can expose those logs directly through the web application using bog-standard JDBC. See demo instance on Heroku, click on the flaky link, and then follow the links to see the records with that correlation id.
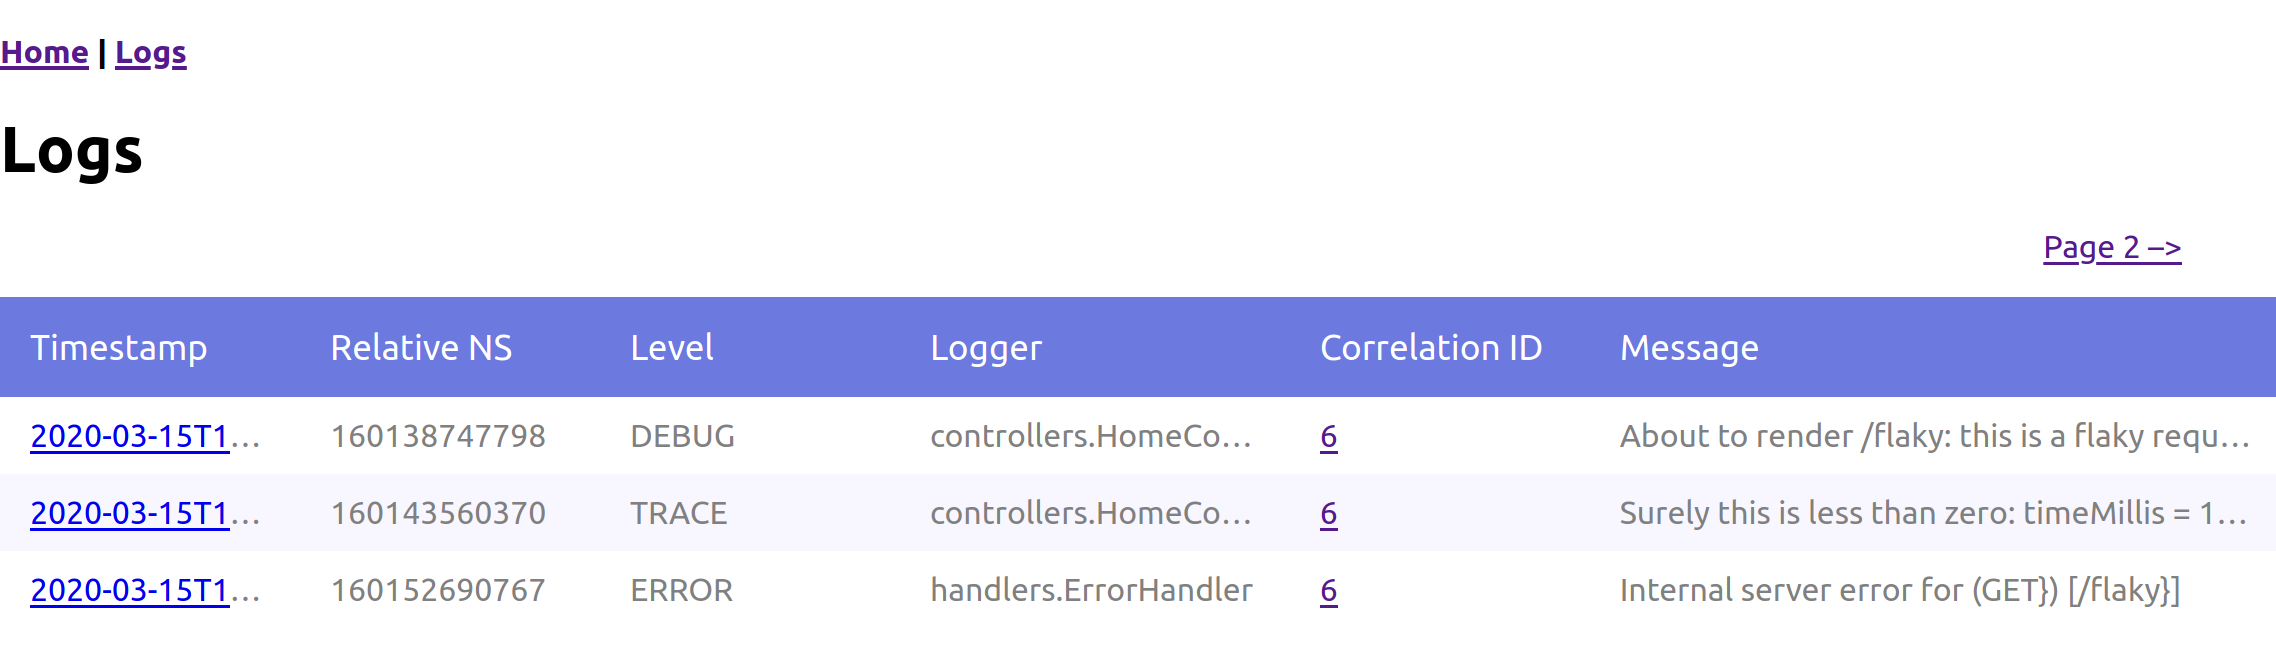
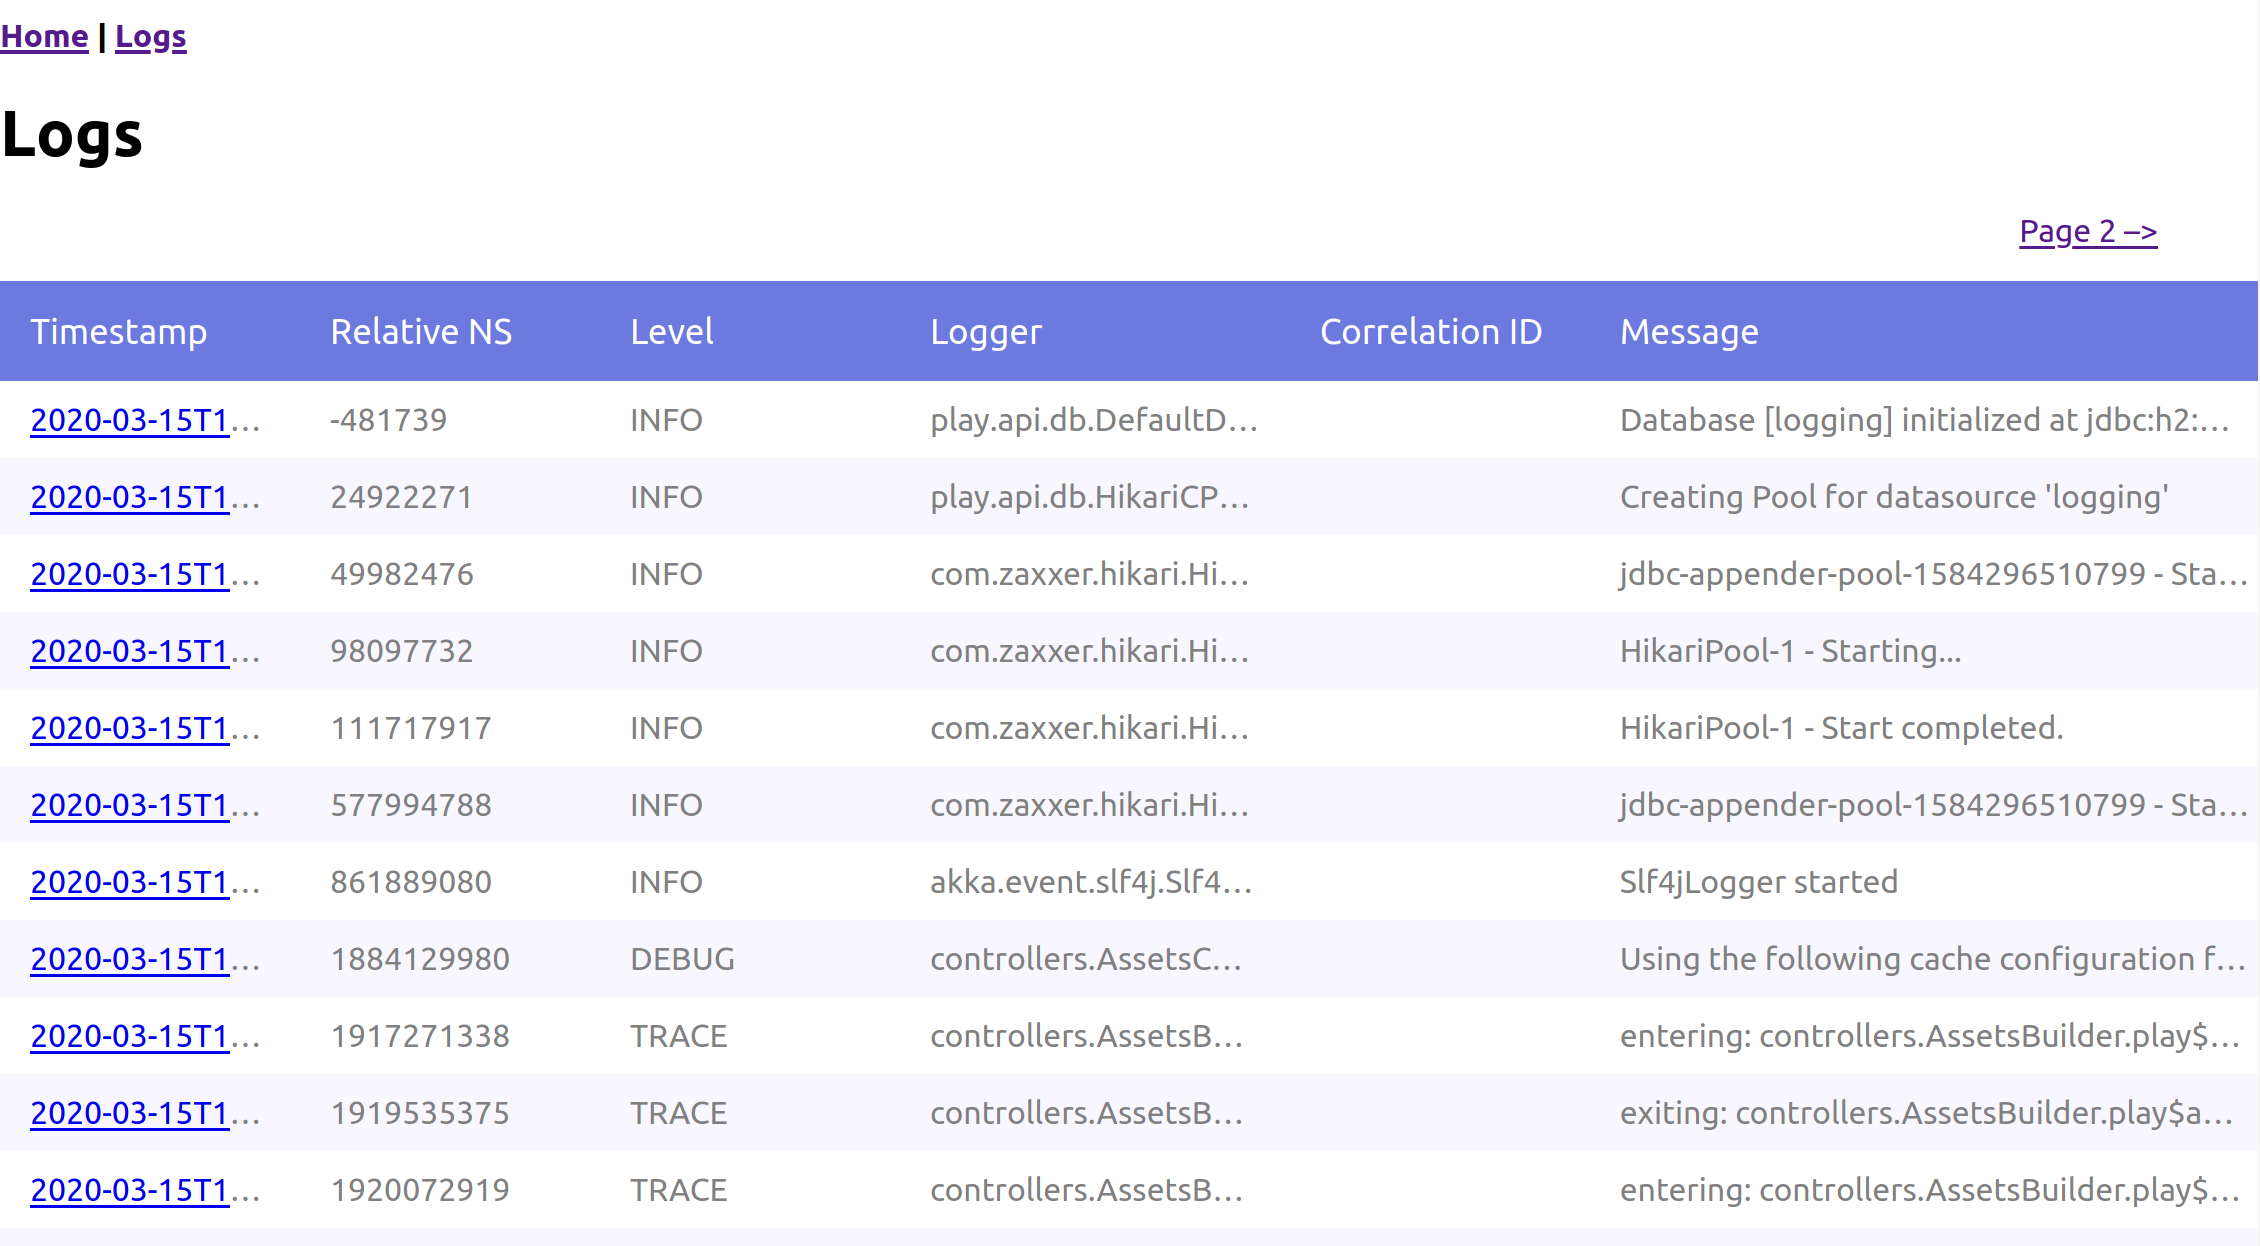
Then click on the logs link to see all the logs, not filtered by correlation id.
You can also see the detail page, which will show you the JSON fields, and a link to Honeycomb. No link to Sentry yet, I'm still trying to figure out how to construct a URL that points to a specific Sentry issue, but I do get the Sentry email.
The Technical Details
There were several interesting/fun things involved in doing this.
The first problem was setting up ring buffers to be more flexible, and upgrading them to be a first class construct.
First: give up on the idea of ring buffers containing processed bytes. Different appenders contain different encoders, so from now on all ring buffers contain instances of ILoggingEvent. Also, upgrade the ring buffer implementation to use a lock free queue.
Second: set up a RingBufferAction and a RingBufferRefAction in Joran, which gave the ability to reference specific ring buffers by reference and hook them into appenders.
<ringBuffer name="JDBC_RINGBUFFER">
  <capacity>${jdbc.ringBuffer.capacity}</capacity>
</ringBuffer>
Third: create a RingBufferAwareAppender which takes an appender-ref and a ringbuffer-ref and a filter. If a record passes the filter, it goes into the appender. If not, it goes into the ring buffer.
<appender name="ASYNC_JDBC_WITH_RINGBUFFER" class="com.tersesystems.logback.ringbuffer.RingBufferAwareAppender">
    <!-- log to jdbc if INFO or above, otherwise log to ring buffer -->
    <filter class="ch.qos.logback.classic.filter.ThresholdFilter">
        <level>${jdbc.threshold}</level>
    </filter>

    <!-- anything denied goes to the ring buffer -->
    <ringBuffer-ref ref="JDBC_RINGBUFFER"/>

    <!-- anything accepted goes to the appender, which has a wrapper for dealing with dumps -->
    <appender-ref ref="ASYNC_JDBC"/>
</appender>
Now we've got the ring buffer populated, but we still need to be able to dump when necessary.
Fourth step: create an appender which does not actually append anything directly, but dumps the records from the ring buffer into another appender, and create a custom logger that is going to be our handle to it.
<logger name="JDBC_RINGBUFFER_LOGGER" level="TRACE" additivity="false">
    <!-- This appender dumps contents of the ring buffer when we log to JDBC_RINGBUFFER_LOGGER. -->
    <appender class="com.tersesystems.logback.ringbuffer.DumpRingBufferAppender">
        <!-- source -->
        <ringBuffer-ref ref="JDBC_RINGBUFFER"/>

        <!-- sink -->
        <appender-ref ref="ASYNC_JDBC"/>
    </appender>
</logger>
Okay, so far so good. Now we need to make sure that the JDBC appender knows that the correlation id is special and can be queried.
Setting up JDBC
Fifth step: Break down the PostgreSQL appender down to a JDBC appender that we can extend from, so we can use it with H2 without using any PGObject code. Change the implementation so that subclasses can add extra columns to the database and define indices on startup. Make it use hikaricp as an underlying connection pool.
Sixth: Add a correlationid module to terse-logback. This is a standalone, vertically oriented set of Logback classes that only deals with correlation id: CorrelationIdJDBCAppender, CorrelationIdProvider, CorrelationIdMarker etc. Set this up in the showcase:
<appender name="ASYNC_JDBC" class="net.logstash.logback.appender.LoggingEventAsyncDisruptorAppender">
    <ringBufferSize>${jdbc.appenderRingBufferSize}</ringBufferSize>

    <!--
        A JDBC appender that adds the correlation id as a field.
    -->
    <appender class="com.tersesystems.logback.correlationid.CorrelationIdJDBCAppender">
        <driver>${jdbc.driver}</driver>
        <url>${jdbc.url}</url>
        <username>${jdbc.username}</username>
        <password>${jdbc.password}</password>

        <include resource="terse-logback/encoders/json-encoder.xml"/>

        <createStatements>${jdbc.createStatements}</createStatements>
        <insertStatement>${jdbc.insertStatement}</insertStatement>
        <reaperStatement>${jdbc.reaperStatement}</reaperStatement>
        <reaperSchedule>${jdbc.reaperSchedule}</reaperSchedule>
    </appender>
</appender>
Now we're done. Set up the showcase with a LogEntryFinder to query for records with a correlation id and present them.
Setting up nanoseconds
First problem: records show up out of order. Is it the JDBC timestamp? No, that has enough resolution. It's Logback: it uses System.currentTimeMillis and so several records show up with the same timestamp. No problem, I'll sort by the H2 serial primary key.
Problem: records show out of order even with the serial id. Right – because HikariCP has a connection pool, insertion order isn't guaranteed. No problem, there's a UniqueIdLoggingEvent that decorates Logback's LoggingEvent and provides a flake id. I'll sort by that.
Second problem: records show up in the right order, but we still don't know how much time elapsed between the two records. I'll know, I'll use System.nanoTime(), and create an event that decorates LoggingEvent with a relative nanotime – now i know that the time between two events is 11981656 - 11808036 = 0.17362 milliseconds.
Third problem: Now I have two classes that decorate LoggingEvent. And there might be more. What I really want are mixins.
Create a ContainerProxyLoggingEvent that has a hetrogeneous typesafe container attached to it. Appenders now add to that map.
<appender name="selector-with-unique-id" class="com.tersesystems.logback.uniqueid.UniqueIdComponentAppender">
    <appender class="com.tersesystems.logback.classic.NanoTimeComponentAppender">
        <appender-ref ref="..."/>
    </appender>
</appender>
Now I can do event.getComponent(UniqueIdProvider.class).uniqueId() or event.getComponent(NanoTimeSupplier.class).getNanoTime() and only have one wrapper around the LoggingEvent – plus, now I can now add as many components to the event as I want, without having to go through markers or structured arguments.
Setting up Play
Now to create spans in Honeycomb. This requires… a start time. Let's add an Instant to the request as a typed attribute in a Play Filter. Then when an error happens, we can capture it in the error handler, and pull it out of the request.
First problem: start times aren't there in the request. It looks like the error handler returns the original, unmodified request, rather than the modified request with the start time. Okay… we can still do this. There's a place where all requests start from, the RequestFactory. We'll just override Play's application loader to use a modified request factory with a start time. Done.
public class StartTimeRequestFactory extends DefaultRequestFactory {
    //...
    @Override
    public RequestHeader createRequestHeader(RemoteConnection connection,
                                             String method,
                                             RequestTarget target,
                                             String version,
                                             Headers headers,
                                             TypedMap attrs) {
        return super.createRequestHeader(connection, method, target, version, headers, attrs)
                .addAttr(Attrs.START_TIME.asScala(), Instant.now());
    }
}
Second problem: Play doesn't have a correlation id. It does have a request id though. Set up a custom action to add correlation id to MDC, then set up tracing markers and span information.
public abstract class AbstractController extends Controller implements LoggingComponent {
    // ...

    static class ContextAction extends play.mvc.Action.Simple {
        private final Logger logger = LoggerFactory.getLogger(getClass());

        @Inject
        Utils utils;

        public CompletionStage<Result> call(Http.Request request) {
            try {
                MDC.put("correlation_id", Long.toString(request.id()));
                return delegate.call(request).handle((result, e) -> {
                    SpanInfo spanInfo = utils.createRootSpan(request);
                    int status = e == null ? result.status() : 500;
                    Marker markers = utils.createMarker(spanInfo, request, result.status());
                    logger.info(markers,
                            "{} {} returned {}",
                            request.method(),
                            request.uri(),
                            status);
                    return result;
                });
            } finally {
                MDC.clear();
            }
        }
    }
}
Then it's a simple matter of programming: setting up a custom error handler to write out backtraces, email Sentry, and send traces to honeycomb. Done.
Oh, and tie JMX beans directly to the controller so we can change log levels without having to type out the full logging path. Okay, now done.
Oh, and add instrumentation so we can show how you can add trace statements to code you don't own. Okay, now really done.
I'm really happy with this. Getting good debugging information out of an application has bugged me for years, and so finally dealing with this makes me feel quite chuffed. I started this almost a year ago now, and I'm still not done. But next up is building a decent Scala Logging API.
Comments