A taxonomy is a "the study of the general principles of scientific classification" according to Merriam-Webster. I've been meaning to put together a taxonomy of logging for quite a while now, so this is going to be a fun one.
Other stuff: I've got a real documentation site and a showcase application showing backtracing from ringbuffer.
TL;DR
The basic units of logging are as follows:
- Log Record: the atomic, immutable unit of output data, also known as a log entry. May be structured.
- Log: an append-only, totally-ordered sequence of log records, typically ingested and stored in a specific format.
- Logging: the function of evaluating input, generating records and optionally sending them to one or more logs.
- Event: a summary of execution of an operation (unit of work). Often used for diagnostics and auditing, may have a specific code, often structured.
- Error: an unexpected failure in a running process, need not be connected to an operation, i.e. database connection failure.
In addition, there is a superset of logging known as tracing:
- Trace: A common identifier held between spans.
- Span: A log record that contains a span id, a trace id, optionally a parent span id, and a duration.
- Tracing: the function of producing, collating, and evaluating traces.
This is a lot of information at once, so let's expand out everything as it comes. To navigate this, let's start with logging, log records, and logs.
Logging
The basic unit of logging is the log record, also known as a log entry. A log record is the atomic unit of logging: it is a packet of data with some immutable attributes. A logging framework typically generates records that contain a timestamp and a string based message, but even that is not guaranteed: a record may consist of a raw string or type, for example.
Logging is the function of taking a record, evaluating it, and rendering to one or more channels.
To give an example of logging, let's start with K&R:
printf("Hello, World!");
This is technically logging! Here, the printf function accepts a log record (the string "Hello, World!") and renders it to STDOUT, a channel which writes out to the console, fulfilling the role of the log. There is an implicit expectation of a format: STDOUT will contain a human readable message that is newline delimited (as opposed to binary data). There's even differentiation of outputs: serious errors are written out to STDERR.
Most logging frameworks add several layers of indirection above the "printing to STDOUT" scenario. They do this by providing a logger, which provides methods specifically for logging. Logging is a system concern: a logging framework expects to be able to handle all of the logging messages inside a given system. When two different frameworks interact, it's usually messy, and usually the frameworks agree on a common facade so that end users can swap between frameworks as necessary. The most well known of these is SLF4J, which is one of the most popular Java frameworks.
A logging framework is also responsible for the logic of managing multiple streams of output and routing and filtering to those streams appropriately. This is important to note, because it's possible for a framework to provide log records, but not logging – as in the case of Java Flight Recorder where there are custom events but no integration to a facade, the only defined output is to a JFR file on disk, and users are responsible for streaming output and managing formats, either directly or through a shell script.
So having said all that, let's see what logging usually looks like with the SLF4J API, using Logback as the implementing logging framework:
Logger logger = LoggerFactory.getLogger("some.example.Class");
logger.info("Hello, world!");
When Logback sees the logger.info statement, it first checks to see if it should generate a log record, called a LoggingEvent in Logback parlance. The LoggingEvent has some intrinsic properties beyond the message: it has a timestamp indicating when the record was generated, the name of the logger that generated it ("some.example.Class"), the level ("INFO"), and some key/value information that it pulls from the thread it was generated from.
A LoggingEvent is much better than a raw string, because it has much more information about how it is generated. However, it does not present much semantic information in the message itself – it's still just a string, and all instances of LoggingEvent have the same fields.
Structured Logging
When a log record contains only a string message with only a loose idea of keywords, brackets, and tabs, it's called unstructured and is not terribly useful. People start using regular expressions and substring matches to find information in logs – this is an expensive and not-fun activity for everyone involved. The worst offender I know of is the garbage collection log, which is so bad it needs custom parsing to extract useful information from it.
A log record that contains rich semantic information that can be record specific is called structured: structured records are significantly easier to parse and store in logs, and provide greater context than unstructured records.
The function of producing these records is called "structured logging," also known as semantic logging. Structured logging is not a property of the logging framework, but it is possible to make it significantly easier to log structured data. Structured logging are typically rendered to logs in a specific format such as JSON or XML or logfmt, but it is actually a property of the record itself – it is possible to have unstructured logging in any format, and a structured record can be serialized to several different logs, each with different formats, e.g. a structured record may be written out as JSON, XML and logfmt, using the same field names and the same basic types.
The first reference I can find to structured logging is in 2006 by Josh Sled who defined it as an alternative to N3 pseudo-statements. Paul Querna followed up in 2011 with Write Logs for Machines, use JSON. Node.js frameworks such as logmagic and bunyan were the first to take advantage of structured logging, perhaps because JSON was already part of the DNA of Javascript based applications.
Somewhere around 2014, there was an agreement to use JSON for structured logging. JSON provides easy key/value pairs, awareness of numbers vs strings, and the ability to do nested data structures, all of which made processing log entries much easier.
The next question is, what attributes should structured logging have? Is there a well known data model or schema for logging?
There's no central schema for what record schema should look like. There are some general guidelines about field names. Different companies have taken their stab at defining schema, with predictable results.
There is Elastic Common Schema, GELF, Timber, and Splunk's Common Information Model, for example. There's even a comparison between different schemas in structured logging frameworks.
Ultimately, the thing that really matters in structured logging is consistency. If you use the same basic conventions and make sure that fields always have the same meaning, you're good.
Structured Logging APIs
The API of the logging framework makes a difference. Bunyan in particular is written structured logging first, and it is far more convenient to render structured attributes through bunyan API, which takes a map for extra attributes as the first argument, and can also take predefined serializers:
log.info({foo: 'bar'}, 'hi');
In comparison, there are four means of adding structured data to a log record through Logback: through a marker or arguments, through thread-local maps like Mapped Diagnostic Context, or through transformation in an appender:
logger.info("log message {}", keyValue("name", "value")); // structured argument
logger.info(append("name", "value"), "log message"); // marker
There are various wrappers on top of SLF4J, but the issue there is that they may hide or control the functionality of logging. Some wrappers will hardcode to JSON, others will stick special data into the message field, and still others will turn off logging levels they don't like.
Properties of Logging
There are special qualities to logging that are often implicitly assumed.
Logging is a side-effect of the system. The output of logging does not get fed back into the system itself, and logging itself should not cause changes in the application overall, both operationally and from a systems perspective. Put more bluntly, you should not see business logic inside a logging block. For similar reasons, logging is not an effect in a strongly typed effect system, although it can be used as modulation of an object capability.
Logging is typically a lossy operation. Input into a logging system may not produce output. This is usually because the input is not sufficently important to produce output. For example, Logback assumes a logger-level hierarchy that assigns thresholds of importance, from ERROR down to TRACE. If the logger hierarchy were set to some.example=ERROR, then the statement logger.info("Hello, world!") would still go through logging, but no log record would be generated. Occasionally logging may be lossy because the logging system is overloaded. This follows from the first assumption that logging is a side effect – past a certain point, if the choice is between an application running smoothly or logging, the application may choose to curtail logging.
Logging may transform or manipulate the information in a log record and append the modified information out to a log. This goes beyond the formatting requirements to turn a date into ISO-8601 format – logging may censor sensitive information such as credit card numbers, substitute template information with real data, and add additional fields that weren't available to the log record.
Logging may append a log record to one or more logs. Logging may write to a file, send a POST request to a remote logging service, print to a terminal, or do all of the above. A log uses a consistent format, and may not write out all the properties of a log record, so it's not a given that you can reconstruct a given log record from logs, or even be able to uniquely distinguish between two records in a log.
Logging Architectures
A full discussion of logging must include a discussion of where all of these log records end up, and what happens to them after they are added to the logs.
The answer is that they go through an observability pipeline of some sort end up stored in a central server somewhere, where they have to be indexed. If you go with a hosted option and don't sample your logs, this is usually… not cheap. As I wrote in an earlier blog post, logging is free, logs are expensive – the machine costs involved in logging a record are dwarfed by the costs of storing those records. Ask about logging bills in a bar at a devops conference and you'll get a full and frank appreciation of the costs involved. Jason Wilder has a discussion of the options here.
The costs of indexing, and of storing those indices, is what makes centralized logging expensive. While some of the pricing model can be attributed towards full text search oriented architectures that don't take structured logging as a first-class construct, part of the costs of a logging architecture come from the nature of log records themselves – because they are individual and stateless, information is often spread over several log messages and must be switched together before the system has enough data to act on it.
This is where events show their advantages.
Events
Events are structured records, but with extra semantic features.
The first feature is summary information – in the unexceptional case, an event is summary of a unit of work in the system. This is roughly Honeycomb's definition.
Errors are unexpected failures of the system. Background errors like lost database connections, network timeouts, and other failures are still logged, but may not be a part of the unit of work, and are not events. There is some overlap: because a unit of work may terminate in an exception caused by an underlying error, an event will summarize the failure of the operation and can contain the exception's error message and stack trace.
Honeycomb is what I tend to point to the most, but there are other event logging systems out there, notably Windows event logging. One nice feature that Windows Event Logging has is an event schema connected to the code.
Generally speaking, if this isn't something that operations would not want to look at, it shouldn't be rendered. This means no unstructured logs, and no diagnostic logging information by default.
Event Logging Confusion
The term "event" is unfortunately highly overloaded, and so it's worth working through some other kinds of events and comparing them with a logging event.
All events have a common feature: a singular (i.e. not aggregated) and atomic notification that a change happened. Events can be categorized as business events (order was completed), security events (user logged in), or framework events (request completed), but generally they are more than a random bundle of data: there is an expected schema associated with the event.
If you're used to big data, then this is where you'll be nodding your head wisely. Likewise, if you're used to CQRS then you may have a concept of an event. However, there are significant differences between a big data event, a CQRS event, and a logging event. Broadly put, data events and CQRS events have a direct effect on the rest of the system, as notifications to the rest of the system. Logging events have a different audience: they are meant specifically for operational observability.
Event APIs
A log record contains one timestamp, and an event is written out as a single log record, at the time that the unit of work ends. This already has implications for the logging API, because it means that any state to be logged must be carried over the lifetime of the operation, from the start of the request all the way through to the result. This usually has consequences for the logging API, as instead of multiple logging statements, there's an accumulation of state followed by a log statement:
Map contextMap;
contextMap.put("userId", userId);
contextMap.put("event", "LOGIN");

// ...At the end of the unit of work
logger.info(contextMap);
This can be handled more easily if there is already a context in scope, i.e. a request undergoing processing that contains its own logger:
public void process(Request req) {
  req.logger().info(lb -> lb.add("userId", userId).add("event", "LOGIN").log());
}
Thread-local context is also an option, but should be considered a fallback because it can fail silently in asynchronous processing.
Decisions must be made about what data is significant. Defining a specific type for events, using a fluent builder API and required/optional fields is the most maintainable way to go, although it takes the most development effort:
public void process(Request req) {
  req.logger(LoginEvent.class).info(lb -> lb.userId(userId).log());
}
This is the approach taken by Windows Semantic Logging, for example. This is much stricter than plain tuple-based structured logging, but ensures that all the fields needed for operations will actually exist and be of the correct type.
However, even with the best designed event API, there is still a catch. The catch is time.
Events vs Time Series
Looking at a single event is like looking at a lightning strike. You can see the complete context and the final result, but you don't have any insight into the flow that made up an event, or the order of operations. You don't know which fork happened first, or which was fastest, only the total shape of the strike itself. The best you can do is correlate between events – first lightning, then thunder.
So let's look at a single event. It would look like this, indicating the result, the duration, and the timestamp:
{ "timestamp": 1580531420905, "state1": "value2", duration_ms: 1, result: "200"}
Let's contrast this with another model of logging: individual log entries connected by a correlation id. In this model, you can see that there's a change in state1 in the log entries:
{ "timestamp": 1580531420904, "correlation_id": 1, "state1": "value1"}
{ "timestamp": 1580531420905, "correlation_id": 1, "state1": "value2", result: "200"}
You can't reconstruct the series of log entries from the event above. Any field in an event is always the most recent value. The closest you can get is providing an array of stage changes and timestamps as a mini "event log":
{
  "timestamp": 1580531420905, "state1": "value2", result: "200",
  "entries": [
    { "timestamp": 1580531420904, "state1": "value1" }
  ]
}
Likewise, if you have a series of logs and you want an event, you have to use a common field, typically known as a correlation id.
You can create an event by finding and correlating together log entries on a common field, but this requires post-processing and may involve correlation over distributed systems. This kind of ETL work is variously known as sessionalization, stitching, or sequencing. And it can be expensive, because these logs are typically static and not designed to work with each other.
All of it. In one fat structured blob. Not sprinkled around your code in functions like satanic fairy dust. You will crush your logging system that way, and you'd need to do exhaustive post-processing to recreate the shared context by joining on request-id (if you're lucky).
— Charity Majors (@mipsytipsy) September 21, 2018
It's usually unwise to disagree with Charity Majors, but it does seem like this presupposes that logs are unstructured and kept in isolated tables. I don't see that stitching has to be expensive, especially with structured records where I could throw everything into a key/value store like RocksDB or FoundationDB and call it a day.
The larger issue, more than recreating a shared context, is that a series of log records has be consistent and tell a story in order to be useful. Currently if you want to figure out what's happening, you have to do it ahead of time – there's nothing in logging that functions like a "watch" in a debugger and will automatically log on changes of state on a field or local variable. This is where tools like Rookout breakpoints are useful, because you can set breakpoints in runtime and have that mapped to instrumentation.
At any rate, the upshot of this is that events are a way to provide a high cardinality data point on the cheap. There's no post-processing that needs to be done, because all the relevant data is already provided in one place. However, this comes with the loss of history, making events less useful for debugging.
Tracing
Tracing is a form of structured logging that assumes duration and hierarchy. In tracing, several log records contain a trace id attribute, where having the same trace id identifies them as a group. Each individual log record identifies as a span, and the spans can indicate a relationship with one another, i.e. a span can be a parent of another span. In addition, a span has a duration – a start time and an end time during which the span was active.
Tracing started with Dapper and is currently available through Opentracing. Yuri Shukro has an excellent book "Mastering Distributed Tracing" that goes into detail about Opentracing.
One of the interesting things about Opentracing is that most tracing takes place under the hood, through instrumentation. Tracing information gets propagated between processes through instrumented HTTP clients and servers. Database queries are sent through instrumented drivers. Calls to Kafka are instrumented through metadata on Kafka records. Even gRPC is handled through instrumentation. As such, it's rare for end users to have to put spans together manually.
Somewhat confusingly, there is a feature in Opentracing for a span to have "logs" attached to it. These have a timestamp and fields key/value pairs that typically consist of message:"Can't connect to mysql server on '127.0.0.1'(10061)" or exception data, but have fairly weak semantic conventions. In practice, these are typically used for capturing error information, and I've never seen them used in a time series context.
Far more common are span tags which apply over the lifetime of the span. This corresponds to the event semantics described above, where a request and the response code are listed in the same log record.
There are two open source solutions for Opentracing: Zipkin and Jaeger. Both Zipkin and Jaeger work on the principle of having a reporter/collector, which is an endpoint on the network that collects a sampling of traces, and stores them to a database. Because all trace and span information is centralized in the same database with a predefined model, there is no post-processing or joining between different logs, and as a result many spans can be joined together relatively quickly.
Tracing API
The Opentracing API for Java operates on the idea of a thread local SpanContext. When crossing an asynchronous boundary, this means that a span must be activated manually on the thread before it is written to, and then closed when the thread gives up ownership. For convenience, a Scope is provided that manages the activation and deactivation of the span:
Scope scope = tracer.scopeManager().active();
if (scope != null) {
    scope.span().log("...");
}
scope.close();
If you want to expose exception information to a span, the span must be manually finished in a finally block:
Span span = tracer.buildSpan("someWork").start();
try (Scope scope = tracer.scopeManager().activate(span)) {
    // Do things.
} catch (Exception ex) {
    Tags.ERROR.set(span, true);
    span.log(Map.of(Fields.EVENT, "error", Fields.ERROR_OBJECT, ex, Fields.MESSAGE, ex.getMessage()));
} finally {
    span.finish();
}
Note that the error is logged using the semantic conventions directly through a map.
For asynchronous code, the span must be passed manually and then exposed through another scope object:
try (Scope scope = tracer.buildSpan("ServiceHandlerSpan").startActive(false)) {
    ...
    final Span span = scope.span();
    doAsyncWork(new Runnable() {
        @Override
        public void run() {

            // STEP 2 ABOVE: reactivate the Span in the callback, passing true to
            // startActive() if/when the Span must be finished.
            try (Scope scope = tracer.scopeManager().activate(span, false)) {
                ...
            }
        }
    });
}
I'm not thrilled about the Opentracing API. I think it leaves much on the table, and the exception handling and logging is clumsy at best. But most of the time, you won't see it or have to work with it.
Properties of Tracing
Instrumentation is critical. The API does take some getting used to, but more of an issue is that instrumentation must get the framework to the point where a parent span is available in the thread, and that's not always under the control of the programmer. If a parent span isn't available or the instrumentation is wrong, then it's possible to write correct code and still not be able to make a coherent trace.
Root spans function as events. Tracing may appear to be a counter-example to events, in that information is spread out across multiple spans. However, in practice many systems will treat the root span as the significant event, and expect any important information to exist as a span tag on the root span. As such, the child spans are used for finer grained resolution on an event.
Tracing involves several spans. By its nature, tracing tends to be organized along distributed services and "unit of work" type operations. Traces don't do well with displaying exceptions in background data like lost database connections or bugs involving corrupt data or state transition.
Querying over traces and spans can be highly variable. There's typically no facility for doing complex searches on span metadata: you can't say "show me traces that have over five spans" for example. Where traces have to be compared, different vendors have different ways of finding things – with Lightstep, correlations are important, with Honeycomb it's heatmaps.
Integrating Tracing with Diagnostic Logging
Ironically, tracing doesn't have much to say about integrating with diagnostic logging. There are no log levels in spans and until recently you couldn't even get the span id or trace id out of Opentracing to associate logger.debug and logger.trace statements with a particular trace.
However, Honeycomb's implementation of tracing, and the fact that both traces and events are stored in the same dataset, means that it's actually possible to dump diagnostic information from ring buffer. I've previously discussed how to do this as a summary in an exception event and through instrumentation, but I've expanded on this to show how to present diagnostic logging in a trace by querying for the request id internally.
As an example, I've got two screenshots here, one showing a trace with diagnostic information rendered as span events:
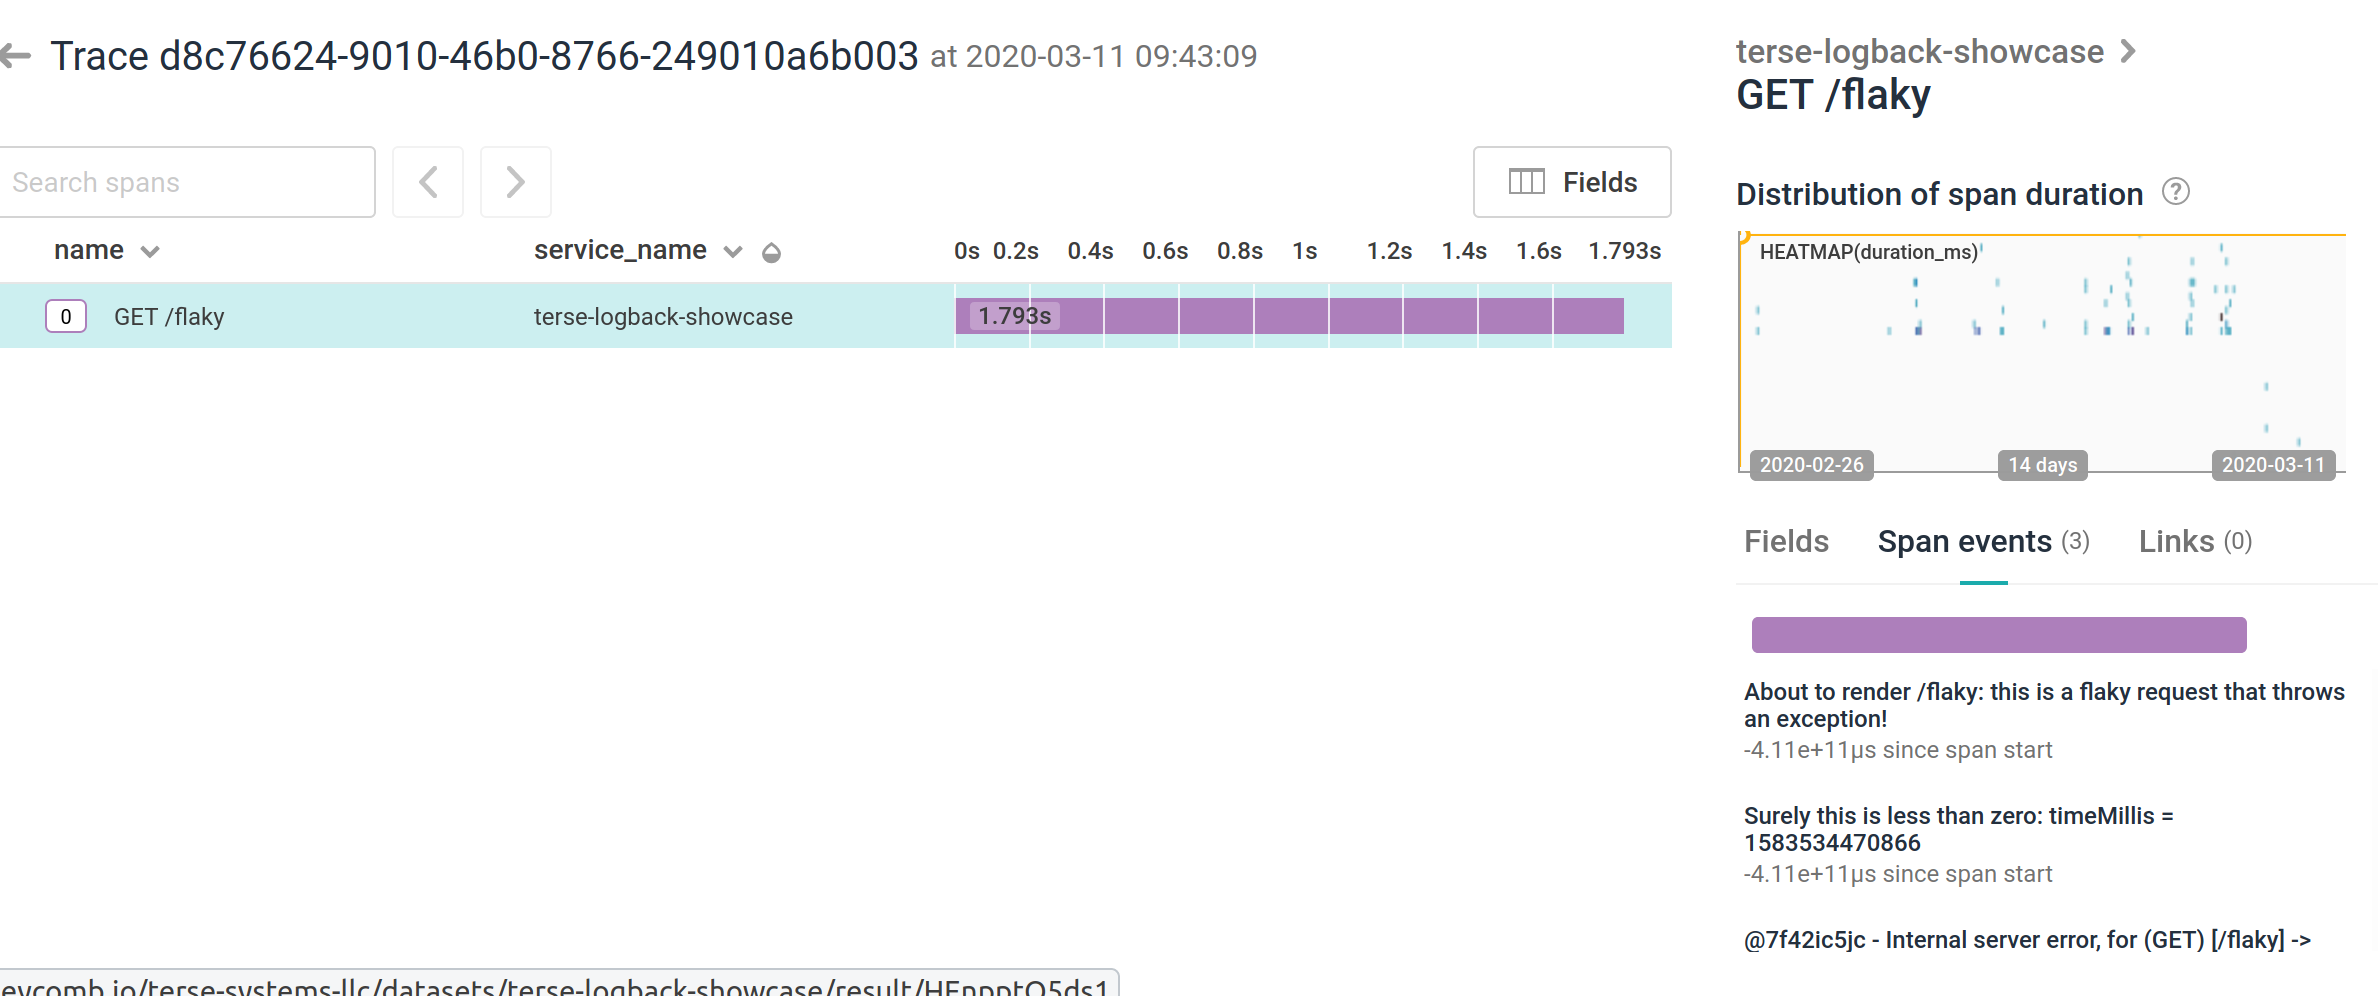
and another one showing diagnostic logging as just plain spans:
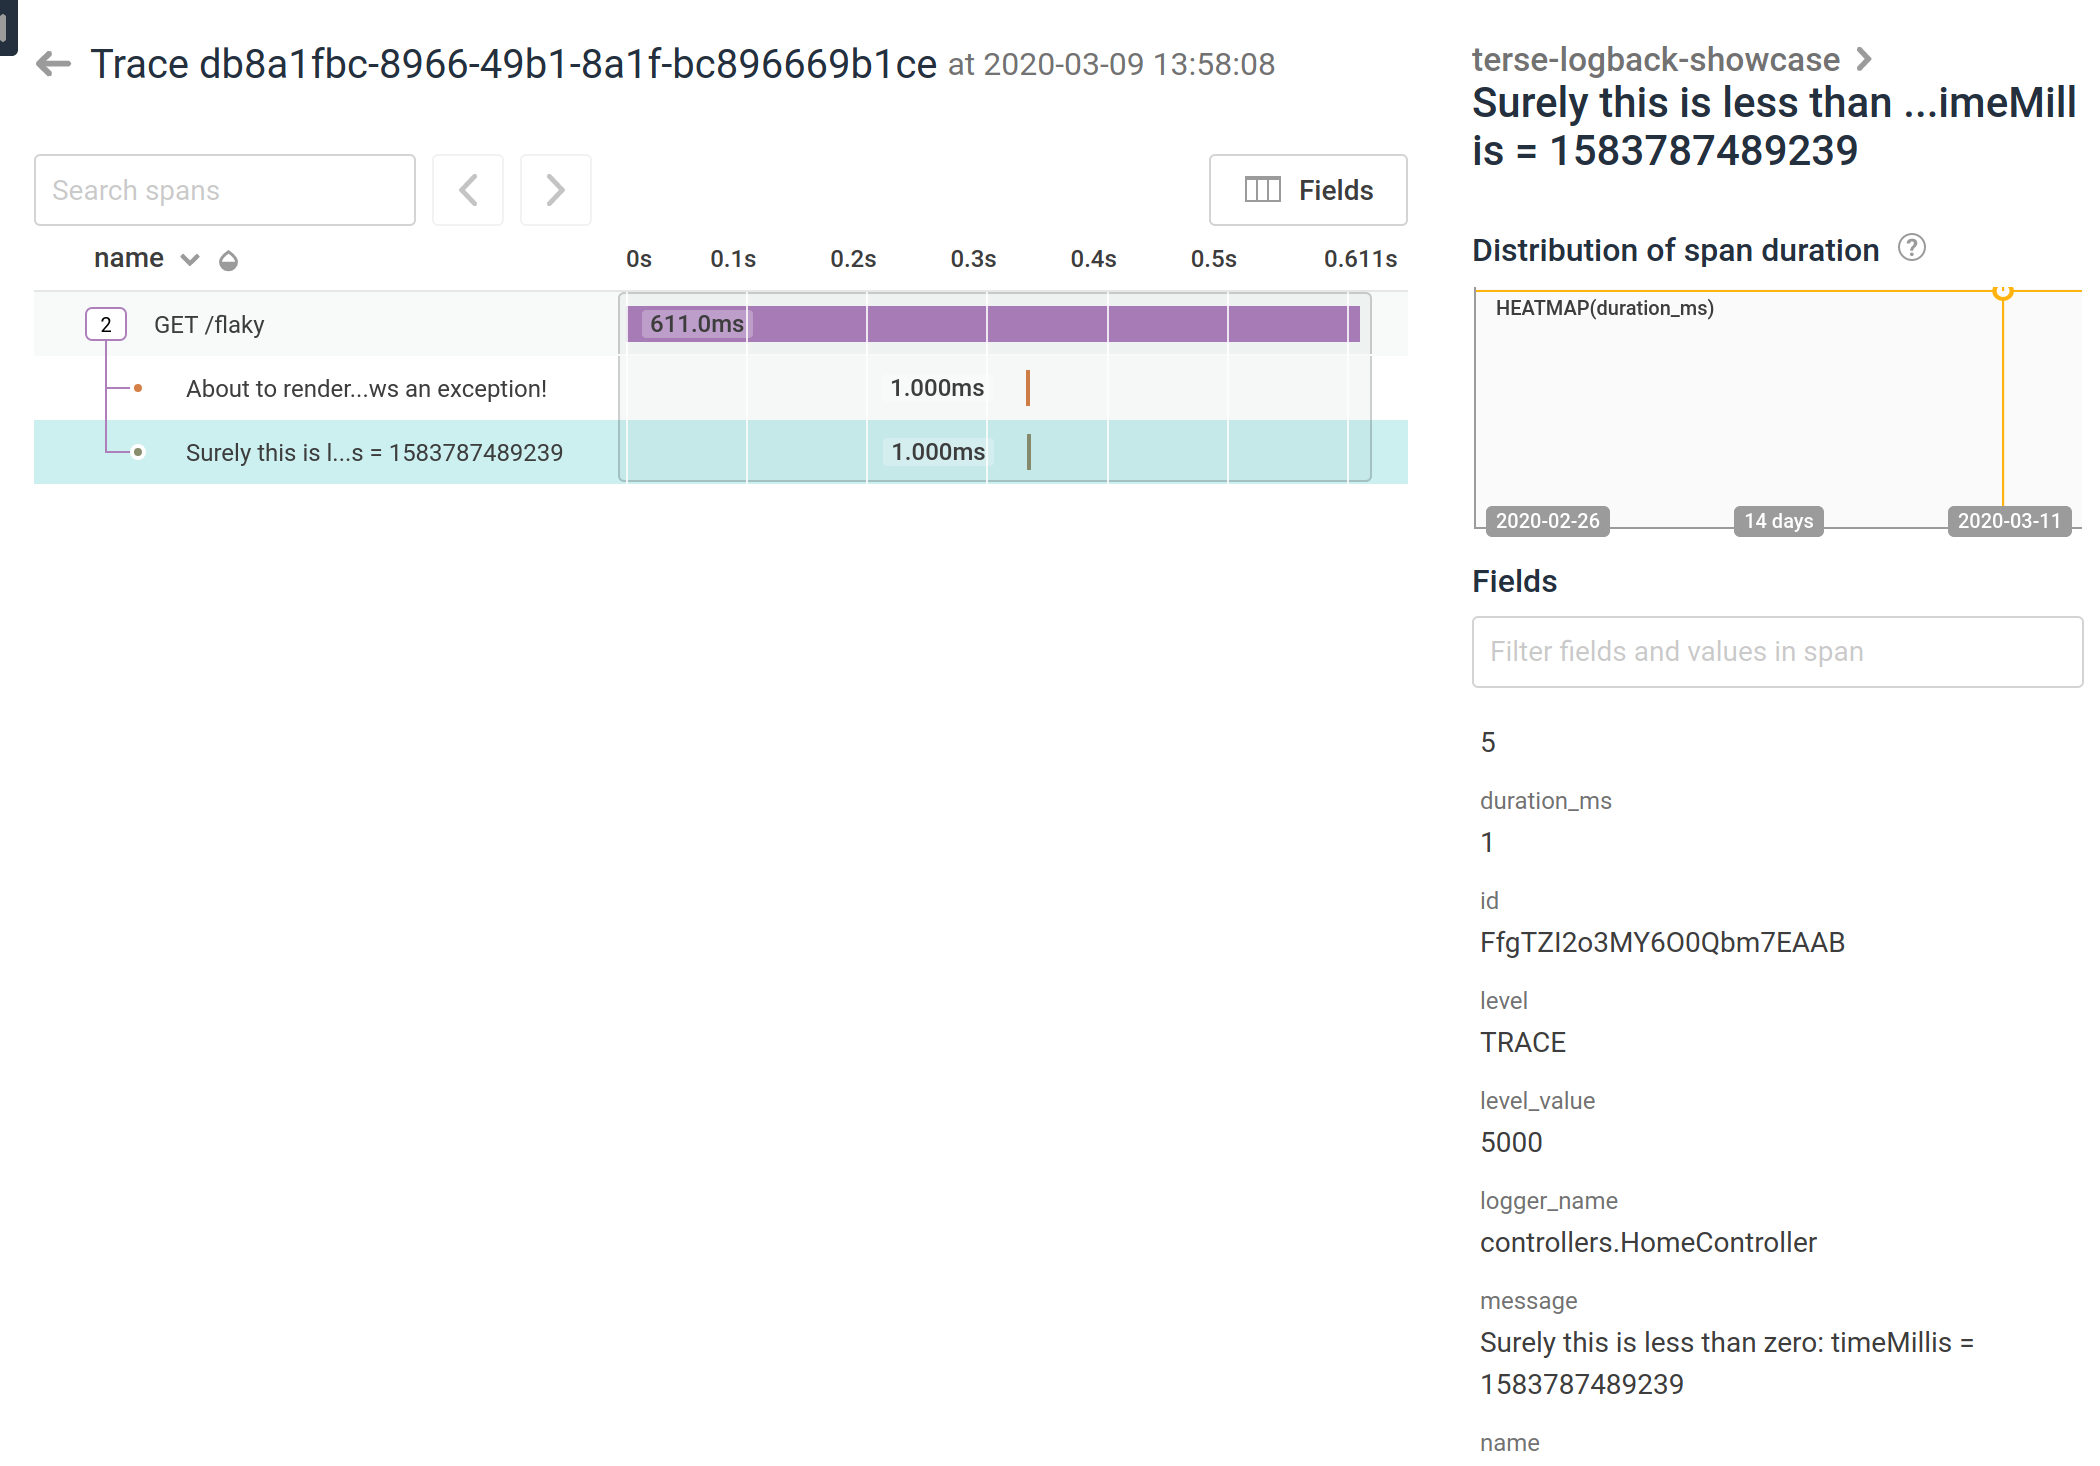
See the showcase logging application for details.
The Trace View
The trace view itself has drawbacks, because it only shows a single trace and does not show the range and median of various spans. As Mads Hartmann says:
One thing that has surprised me is that we don’t use the trace-view very much. We’re mostly slicing & dicing heatmaps until the problem reveals itself. I think the reason the trace-view is so prevalent is that it very clearly, and visually, explains what traces are in a way that’s easier to understand than “A trace is a tree of spans”. But a single trace is rarely very interesting - it’s the patterns between many of the same traces that help you understand the behavior of your systems. If all my distributed tracing tool did was show individual trace-views, but didn’t give me a way to query and aggregate them on the fly, it really wouldn’t be of much use.
I’ve lamented in the past how most of the “innovation” I see happening in the tracing space on the UI/UX front appears to be limited to including additional metadata in a trace, embedding high-cardinality information in traces, or providing the ability to drill down into specific spans or enabling intertrace and intratrace queries, all while cleaving to the traceview as the primary visualization medium. So long as this remains the case, distributed tracing will, at best, come a poor fourth to metrics, logs and stacktraces for debugging purposes, and at worst end up proving to be a time and money sink.
And finally Tracing is More Than Traces: The Insights in Trace Aggregates / video:
The value proposition for distributed tracing is well-understood: assembling and visualizing end-to-end transactions helps to identify latency bottlenecks and provides a head-start on problem diagnosis. Yet the data from traces – when aggregated – can reveal much more, and can do so with greater precision and certainty. This talk presents the profound insights trace aggregates help unlock, including sources of resource contention, latency anomalies in the context of service infrastructure, and correlations of metrics with high-cardinality characteristics of the distributed system. The talk demonstrates, using concrete examples, how novel applications of aggregated traces reveal new opportunities for performance improvements. However, aggregation is not possible without a standardized tracing output format, as well as a proliferation of traces via cloud-native service mesh integration.
Conclusion
This started off as a fairly short blog post to delinate and define logging and the various parts. Log records can exist as unstructured data or as complex structured data, and can also represent events and traces through agreed on semantics and fields. This is not the final word on what logging is (I recommend Logs and Metrics for further reading), but I hope it proves useful.
Comments