TL;DR
I've upgraded the instrumentation code in logback-bytebuddy to add trace ids and span ids, so you can see the parent/child relationship between traces. This can be sent to Honeycomb to visualize the trace automatically.
For example, you can instrument the JSSE trust manager code:
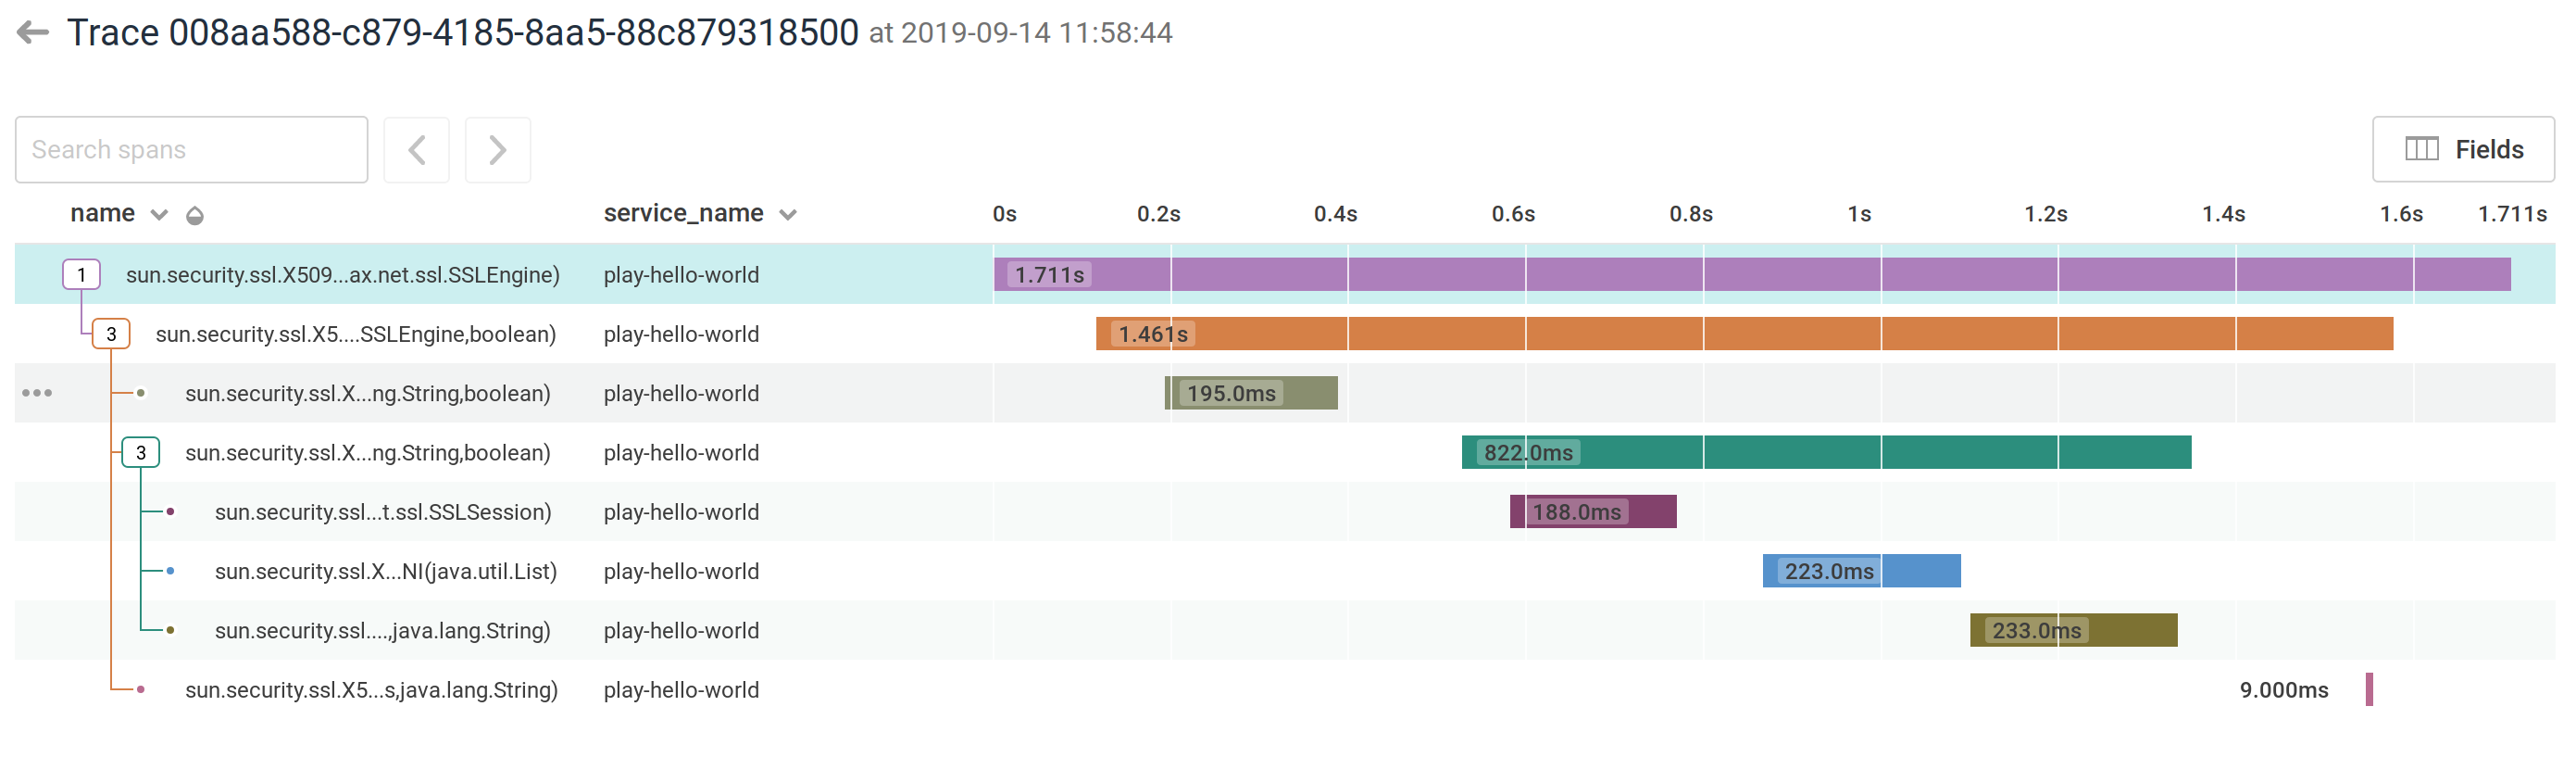
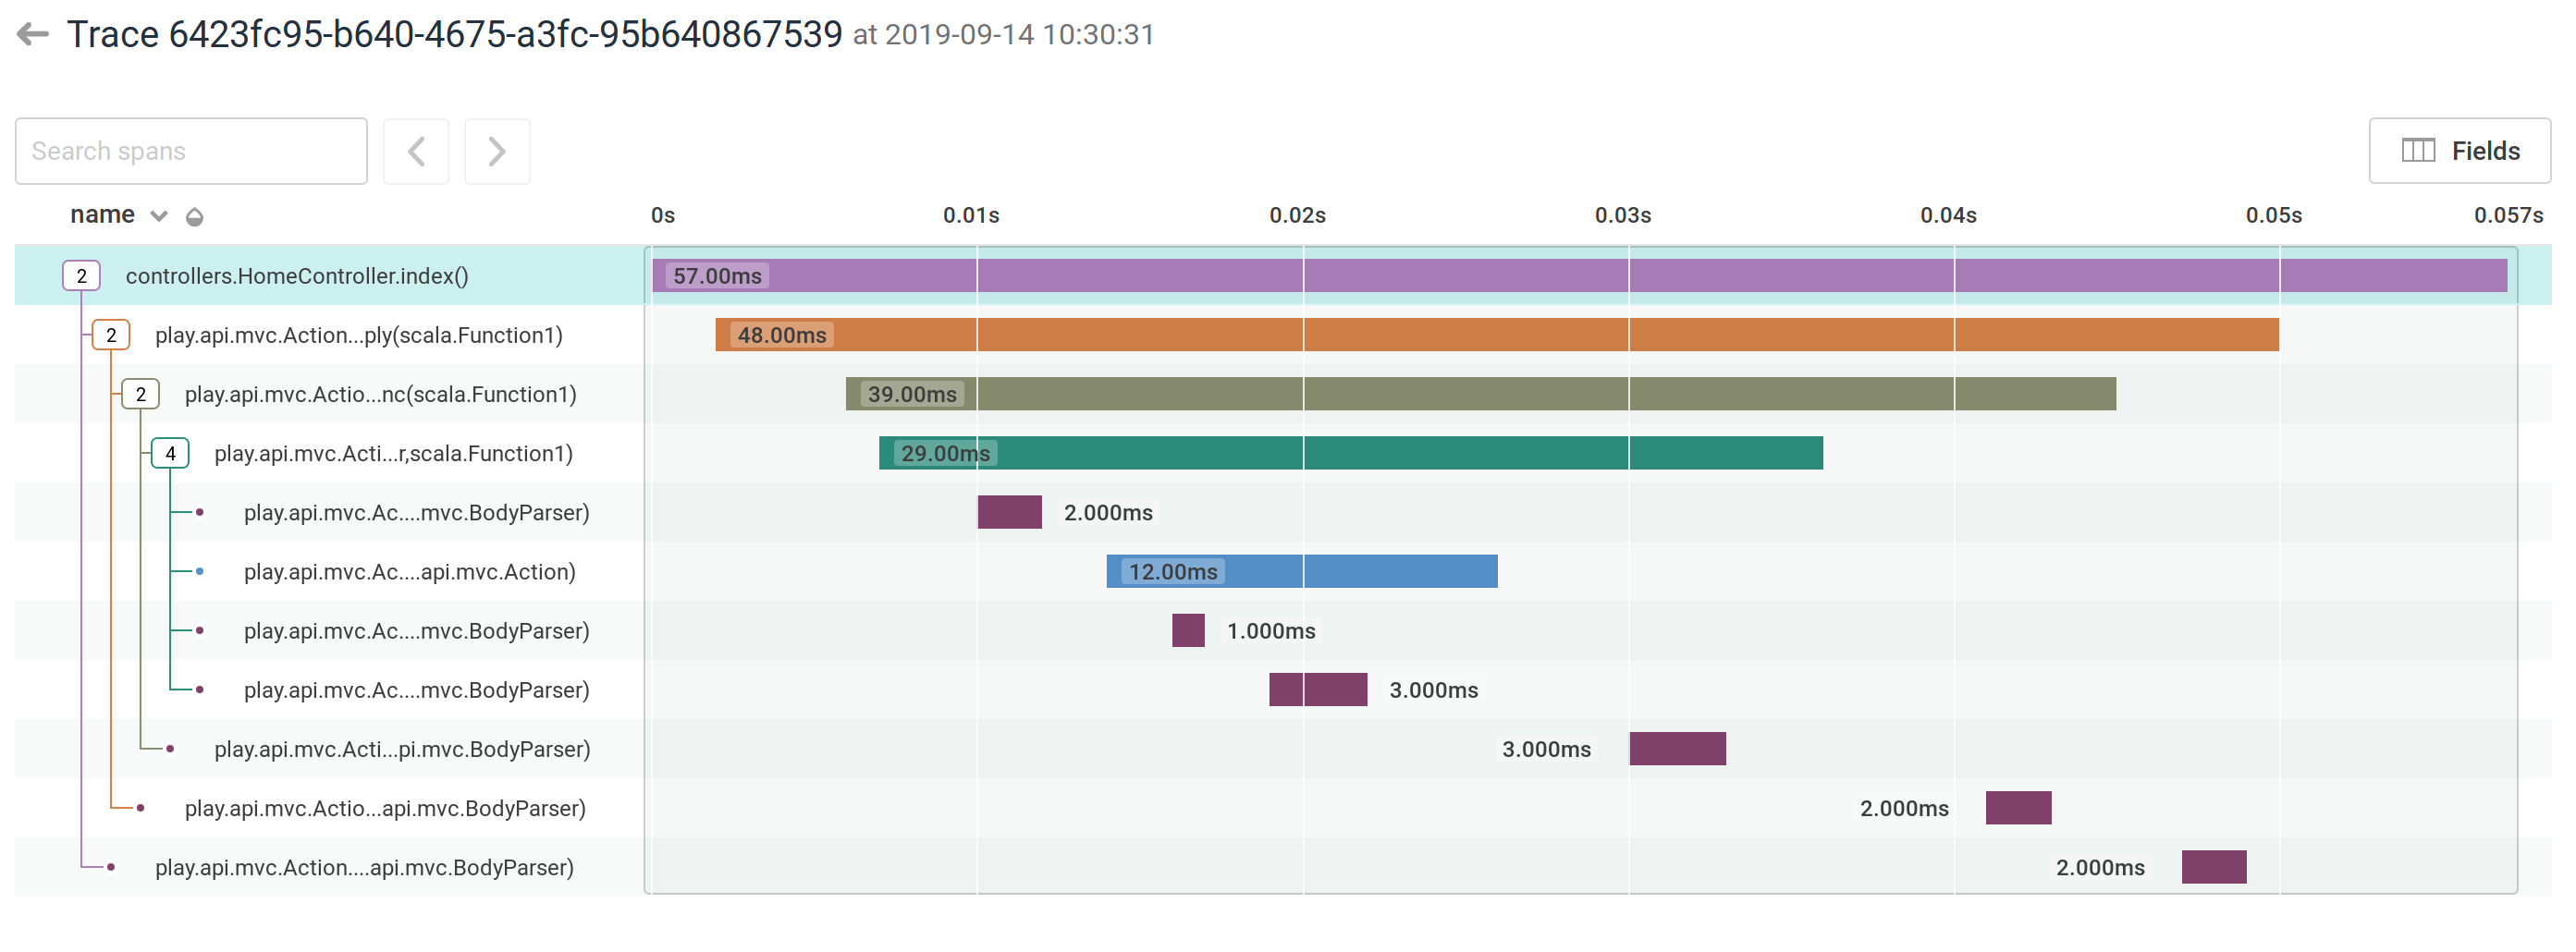
Or see what happens inside a Play ActionBuilder:
Overview
This is an combination of Tracing With Logback and Honeycomb and Tracing 3rd Party Code. There really isn't a difference between tracing and logging: it's just about adding in a couple of extra fields.
With that in mind, adding in tracing is as simple as adding a stack of spans to a ThreadLocal and then pushing and popping as you enter and exit instrumented methods. Most of the work done has been in figuring out the configuration and pulling out as much information as possible – for example, the line number and source file is now pulled from the bytecode so that Logback doesn't have to fill in a stack trace for caller data.
From there, you can identify hotspots in code without adding a full-on profiler, by identifying the hotspot and code flow.
The instrumentation code has been upgraded so that you can add a service name and map functions under classes in logback.conf, and wildcards are now supported:
levels {
  sun.security.ssl = TRACE
  javax.net.ssl = TRACE
}

logback.bytebuddy {
  service-name = "example-jsse"

  tracing {
    "sun.security.ssl.X509TrustManagerImpl" = ["*"]
    "javax.net.ssl.SSLContext" = ["*"]
  }
}
Because this produces JSON in a format that Honeycomb recognizes, we can then send this data to Honeycomb and use it for visualization.
Pros and Cons
I'm a developer, and this is a developer tool. It solves several problems that developers have in observability, while integrating nicely into existing developer logging.
The biggest advantage is that you get development-free tracing. As opposed to Opentracing, there's no concept of tying a span to a request or other "unit of work" – it starts when entering the first method, and ends in the last. If you completely cover your classes, you'll get a complete trace, including input parameters and return values.
The second biggest advantage is that you can do full tracing, including duration time, of code that you didn't write. This won't cover everything – for example, it won't cover native methods – but it'll cover lots.
The next advantage is that you'll be able to integrate this with the logs you already have. Accessing the tracer is straightforward. This is pretty great for diagnostic logging and debugging in a development environment.
The disadvantages are that it can take longer for the JVM to start up as classes are instrumented. It does not integrate with Opentracing at all, and has no idea about what request code is used.
It does not provide intuitive output when using multi-threaded code and functional programming style code can result in a bunch of <Function1>; being returned as the output.
There is no protection for pathological input – whatever is provided as parameters and return values is rendered using toString and there is no abbreviation or limit on the length of a list.
Needless to say, printing out the complete inputs and outputs to all your operations will make a mess of your security.
Finally, instrumentation and tracing will slow down internal code quite a bit. Performing non-deferred JSON operations in system code is not something you can do without cost, and so the tracing spans durations here are going to be relative rather than absolute.
Summary
Instrumented tracing is a useful tool, and it doesn't take much setup or framework to make it work and to visualize it.
You probably shouldn't use this in production, particularly in security or performance sensitive code. In staging or in development, when you want to see what's going on, it works great and can be tweaked with HOCON to show everything you want.
Comments