I've been working with Logback for a while now, and one of the things that stands out is how people will talk about "fast" or "performant" logging, with the theory that picking the right encoder or the right appender will make things work. It's not wrong, but it's not exactly right either.
So, this blog post discusses latency and throughput in Logback, along with some fun non-obvious things that can cause production issues if you're not careful. And it has pictures!
Latency
Latency is defined as the amount of time required to complete a single operation.
Latency is a surprisingly slippery concept, because as soon as you start aggregating latency times, you can end up with visualizations that can omit or obscure parts of the picture. Latency can be defined as averages, percentiles, histograms (useful for "long tail" latency), or heatmaps.
Because we're talking about conceptual latency here, we'll talk about the "average" latency between a logging statement, and a statement being logged.
@BenchmarkMode(Array(Mode.AverageTime))
@OutputTimeUnit(TimeUnit.NANOSECONDS)
class SLF4JBenchmark {
  import SLF4JBenchmark._

  @Benchmark
  def boundedDebugWithTemplate(): Unit =
    if (logger.isDebugEnabled) {
      logger.debug("hello world, {}", longAdder.incrementAndGet())
    }
}
And using an encoder and appender like this:
<configuration>
  <appender name="FILE" class="ch.qos.logback.core.FileAppender">
    <file>testFile.log</file>
    <append>false</append>
    <immediateFlush>false</immediateFlush>
    <encoder>
      <pattern>%-4relative [%thread] %-5level %logger{35} - %msg%n</pattern>
    </encoder>
  </appender>
</configuration>
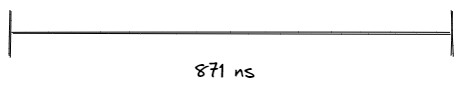
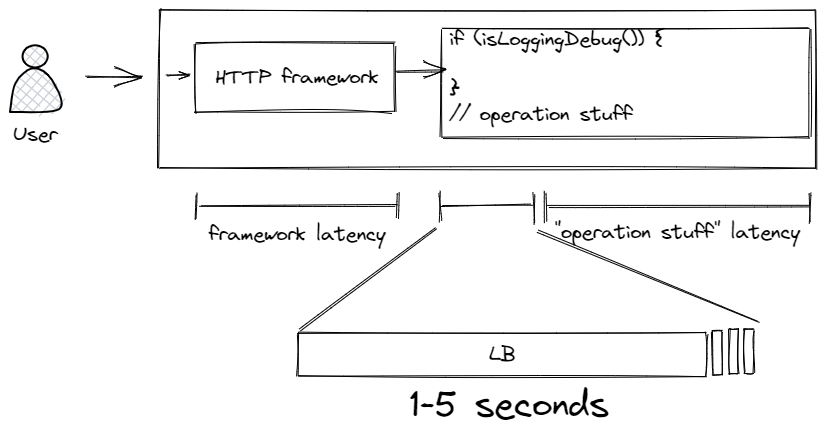
Say that boundedDebugWithTemplate takes roughly 871 nanoseconds as measured by JMH. We can visualize this as a straight line, from the time of logging to the time that bytes were appended to a file.
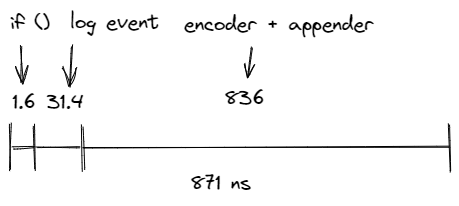
But logging is made up of several operations. For example, if we swap out the file appender for an no-op appender that does nothing but create the logging event and a message based off the template, we can see that the same operation takes only 33 nanoseconds. If we set the logger to INFO level, we can see the isLoggingDebug call takes only 1.6 nanoseconds. So in reality, what we're looking at is more like this:
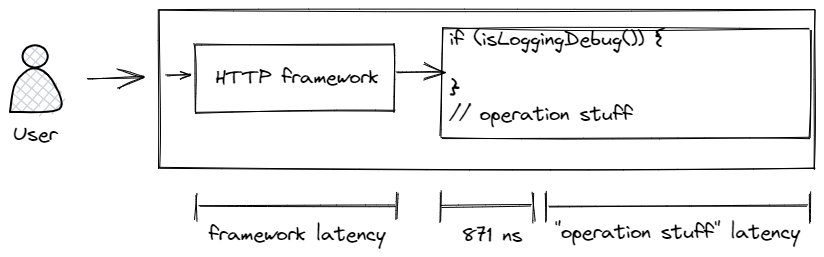
Because the FileAppender is blocking and Logback runs everything in the calling thread, this means that turning on debugging in an operation will add ~871 ns to every call.
This also compounds for every blocking appender. The initial costs of putting together the logging event happen once, but if you have a STDOUT appender, a file appender, and a network appender, they all encode the logging event using distinct encoders, and render sequentially on the same thread.
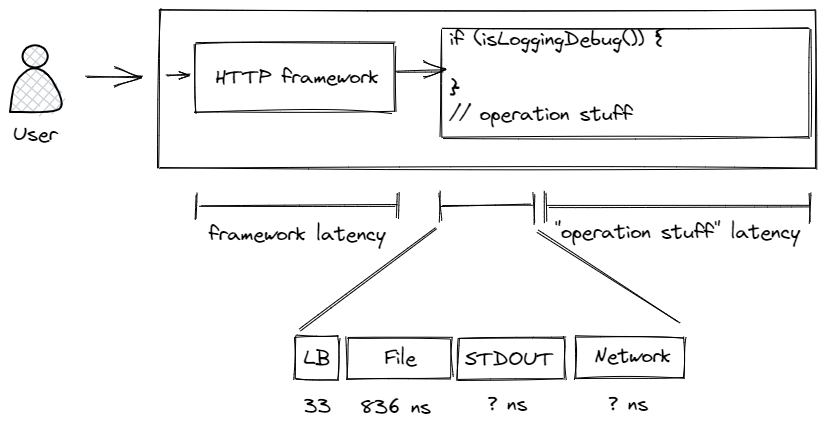
In practical terms – the more appenders you add, the slower your code gets when you log.
It's important to note at this point how tiny a latency of 871 nanoseconds is – for comparison, instantiating any Java object costs around 20 nanoseconds. For most operations, logging is not the bottleneck compared to the costs of the operation itself – unnecessary database queries, blocking on network calls, and lack of caching are still the low hanging fruit.
However, it is still a cost. Moreover, looking at the average latency doesn't tell you about the outliers – the "long tail" of latency. If an operation blocks in any way, then that cost will be passed on to the application. And blocking can happen in the most insidious of ways.
The obvious source of blocking is when a logging event or message includes a blocking call. For example, calling UUID.randomUUID() blocks because of the internal lock, or calling toString() on a collection that contains java.net.URL objects, causing hundreds of DNS resolutions. This can block an HTTP request for multiple seconds, and it won't be immediately obvious from looking at the logs.
But blocking is not solely an input problem though – blocking can come from Logback itself.
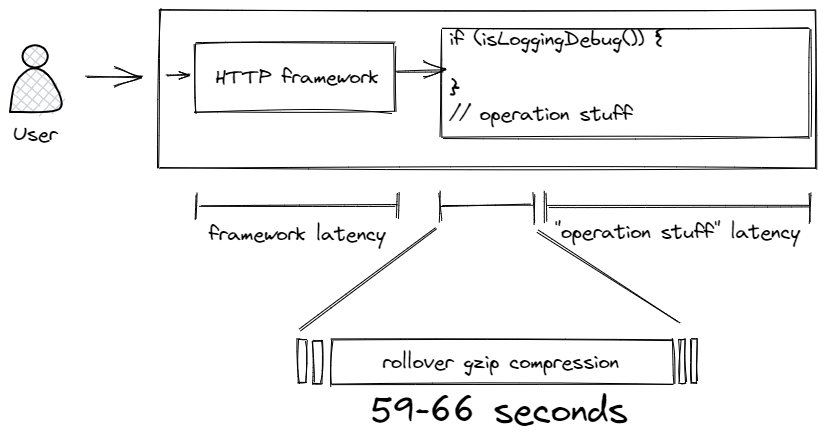
Blocking in Logback can come from appenders. Anything extending AppenderBase uses a synchronized lock that ensures only one thread is appending. While it looks like blocking in appenders is a small consistent cost, this is not always the case. For example, a rolling file appender can block on rollover. LOGBACK-267 means that if you use FixedWindowRollingPolicy and enable compression by specifying a .gz suffix, then compressing multi-gigabyte files can stall the appender, blocking all logging for 55 to 69 seconds. The underlying cause is that FixedWindowRollingPolicy.java calls compressor.compress, as opposed to TimeBasedRollingPolicy.java which uses compressor.asyncCompress.
You might think the problem of blocking can be easily avoided, but it's not quite that simple. Blocking can happen at the kernel, even when writing to memory mapped files, as the operating system manages writes. This causes issues. Filesystem blocking can occur even in software RAID or a network backed VFS. In short, when files were created this made lots of people angry, and was widely regarded as a bad move. I suspect that the TCP appenders and TCP network stack work differently, but then the assumption is that the network is reliable.
Asynchronous Logging
There is a way to avoid unanticipated blocking: we can log asynchronously. Asynchronous logging is a trend, with asynchronous GC logging in Corretto 17 coming out for the JDK itself.
There are several ways to implement asynchronous logging. Echopraxia can address it at invocation with an asynchronous logger, deferring argument construction and condition evaluations and allowing caller information for free, at the cost of a more complex method interface. Alternatively, asynchronous logging can be implemented in an appender, although this does mean that argument and LoggingEvent construction happen on the calling thread.
Logback does have an out of the box async appender, but the LoggingEventAsyncDisruptorAppender from logstash-logback-encoder is much richer from a feature-based perspective; it by default drops all events when full, can warn when full, and has more customization available on ringbuffer size and behavior. From a performance perspective I'd say it's a wash for most people – note that the logback performance page discusses throughput, so it's not an apples to apples comparison.
<appender name="async" class="net.logstash.logback.appender.LoggingEventAsyncDisruptorAppender">
    <appender class="ch.qos.logback.core.rolling.RollingFileAppender">
        ...
    </appender>
</appender>
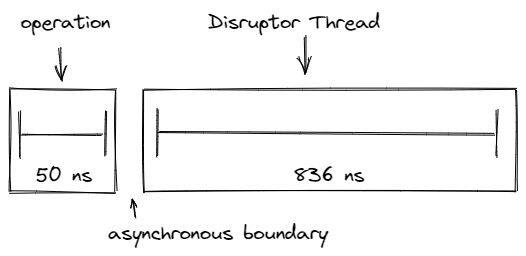
An async appender will accept LoggerEvent, and will write to an in-memory ring buffer that is used by a dedicated thread to write to the enclosed appenders.
On average, the mean latency for a disruptor is ~50 nanoseconds, up to a worst case scenario of 420 ns when the queue is fully loaded. This means that the rendering thread only incurs the latency cost of 33 ns (eval + logback event) + 50 ns (enqueuing), but does not incur the latency cost of appending to file. An asynchronous boundary exists between the thread running the operation, and the thread that picks up the logger and writes to the appenders.
Using multiple threads enables logging to be concurrent, running alongside operations without interfering with them. There is a difference between concurrency and parallelism: if there's only one core available, then the two threads may run interleaved, and there may be a small delay in writing the logs. If there are multiple cores available though, then typically the thread will be writing logs in parallel.
There are some special cases / catches to asynchronous logging.
The first catch is not adding a shutdown hook; you need to let the ring buffer gracefully shutdown, and if Logback shuts down immediately you will miss events that could be critical.
The second catch is to use unnecessary async appenders, each wrapping a single appender. This can be a waste of threads; you only need one to create an asynchronous boundary. If you do not anticipate significant load and your appenders are fast, my recommendation is to define the appender at the root, before you do anything else.
<configuration>
  <shutdownHook class="ch.qos.logback.core.hook.DelayingShutdownHook">
    <delay>150</delay>
  </shutdownHook>

  <root level="all">
    <appender class="net.logstash.logback.appender.LoggingEventAsyncDisruptorAppender">
      <appender name="FILE">...</appender>
      <appender name="STDOUT">...</appender>
      <appender name="TCP">...</appender>
    </appender>
  </root>
</configuration>
The third catch is what happens to asynchronous logging when there is significant load. Ring buffers can fill up when the underlying appenders are slow and do not drain the buffer fast enough, and a full ring buffer can result in dropped events.
Therefore, if you do have an appender that's awkward (and you can't fix it), you should configure a distinct appender for it and configure it so it doesn't jam up the others.
<configuration>
  <root level="all">
    <appender class="net.logstash.logback.appender.LoggingEventAsyncDisruptorAppender">
      <appender name="FILE">...</appender>
      <appender name="STDOUT">...</appender>
      <appender name="TCP">...</appender>
    </appender>

    <appender class="net.logstash.logback.appender.LoggingEventAsyncDisruptorAppender">
      <ringBufferSize>[some large multiple of 2]</ringBufferSize>
      <appender class="RollingFileAppender">
        <!-- trigger LOGBACK-267 -->
        <rollingPolicy class="FixedWindowRollingPolicy">
          <fileNamePattern>backup%i.log.gz</fileNamePattern>
          ...
        </rollingPolicy>
        <triggeringPolicy>
          <maxFileSize>4GB</maxFileSize>
        </triggeringPolicy>
        <encoder>...</encoder>
      </appender>
    </appender>
  </root>
</configuration>
You may lose some events if it spills over, but that's better than stalling your application.
You can also add an appender listener to notify you of any dropped messages. The FailureSummaryLoggingAppenderListener implementation will log a summary of any dropped messages, but it does have the drawback that the listener logs the summary to the same appender that is dropping messages – so the summary itself can be lost. You are better off writing your own implementation from the interface, and using it to send to your metrics or error reporting system in a scheduled runnable using the ScheduledExecutionService from Logback's Context.
Throughput
The throughput of an application is how many operations it can process over a period of time. This is typically the metric we care about for batch operations and things that happen in the background.
Throughput is a tricky quantity to measure, because doing operations in bulk improves throughput, but can cause applications to seem unresponsive, and vice versa. For example, writing to STDOUT is "fast" because of I/O buffering, but writing STDOUT to a terminal is slow, because users expect immediate feedback.
Let's see what raw disk throughput looks like on my laptop.
public class Main {
  private static final org.slf4j.Logger logger = org.slf4j.LoggerFactory.getLogger(Main.class);

  public static void main(String[] args) {
    Timer timer = new Timer();
    timer.schedule(new TimerTask() {
      @Override
      public void run() {
        System.out.println("Exiting");
        System.exit(0);
      }
    }, TimeUnit.MINUTES.toMillis(1));

    int threads = 1
    for (int i = 0; i < threads; i++) {
      final String name = "logger-" + i;
      Thread t = new Thread(name) {
        @Override
        public void run() {
          while (true) {
            logger.info("Hello world!");
          }
        }
      };
      t.start();
    }
  }
}
Using the sifting appender together with the thread name based discriminator.
<configuration debug="true">

  <appender name="FILE" class="ch.qos.logback.core.FileAppender">
    <file>application.log</file>
    <append>false</append>
    <immediateFlush>false</immediateFlush>
    <encoder>
      <pattern>%-4relative [%thread] %-5level %logger{35} - %msg%n</pattern>
    </encoder>
  </appender>

  <appender name="SIFT" class="ch.qos.logback.classic.sift.SiftingAppender">
    <discriminator class="org.example.ThreadNameBasedDiscriminator"/>
    <sift>
      <appender name="FILE-${threadName}" class="ch.qos.logback.core.FileAppender">
        <file>${threadName}.log</file>
        <append>false</append>
        <immediateFlush>false</immediateFlush>
        <encoder>
          <pattern>%-4relative [%thread] %-5level %logger{35} - %msg%n</pattern>
        </encoder>
      </appender>
    </sift>
  </appender>

  <root level="INFO">
    <appender-ref ref="FILE"/>
  </root>

</configuration>
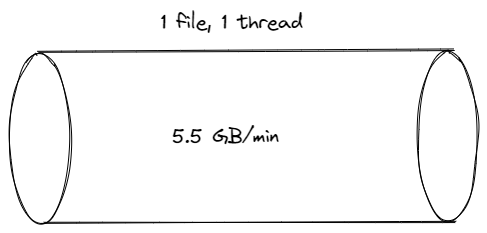
Run it for 1 minute, 1 thread, one FILE appender (100% core usage) = 5.5GB
-rw-rw-r-- 1 wsargent wsargent 5815185001 Oct 16 14:13 application.log
There are use cases where you may want to log this much! If you want to enable total debug output on your local filesystem and nothing else is involved in file IO, then yeah, why not? This is the premise behind diagnostic logging in Blacklite, where you keep a rolling buffer of debug events in SQLite that you can dip into for extra context when an error occurs.
However, in most circumstances, your issue will be too much throughput rather than too little. I've already written about the costs involved in indexing and storing logs in Logging Costs so I won't go over them again – suffice to say that your devops team will not be happy at these numbers if you are planning to log at INFO or above and send it to a centralized logging environment.
Instead, I want to look more at the bottom line number. Is there any way we can make this faster?
First, let's just up the number of input threads logging, just to confirm that the bottleneck is on the backend.
1 minute, 4 threads, one FILE appender = 4.4GB
-rw-rw-r-- 1 wsargent wsargent 4777409363 Oct 16 16:37 application.log
Huh. Throughput goes down when we log from multiple threads. This is likely due to single writer principle.
But maybe it's the encoder that's slowing things down before it reaches the filesystem. One tip from this podcast where Daniel Lemure says that CPU bottlenecks can come before IO bottlenecks, even though it's not popular orthodoxy. Using htop, it looked like it was maxing out a single core in the process, so let's work from there.
If we ran several threads to several different files, then we can avoid the bottleneck on a single core. Let's see what happens when we use the sifting appender to multiplex multiple threads to multiple files.
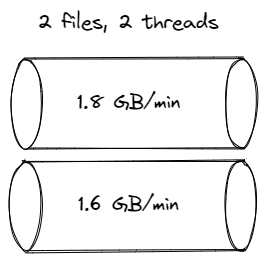
1 minute, 2 threads, sifting appender (90% core usage on two threads) = 3.3 GB:
-rw-rw-r-- 1 wsargent wsargent 1804883163 Oct 16 14:16 logger-0.log
-rw-rw-r-- 1 wsargent wsargent 1614980252 Oct 16 14:16 logger-1.log
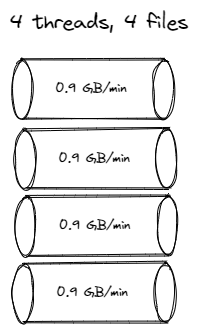
1 minute, 4 threads, sifting appender = 3.5 GB
-rw-rw-r-- 1 wsargent wsargent 977745435 Oct 16 14:20 logger-0.log
-rw-rw-r-- 1 wsargent wsargent 914416956 Oct 16 14:20 logger-1.log
-rw-rw-r-- 1 wsargent wsargent 954032694 Oct 16 14:20 logger-2.log
-rw-rw-r-- 1 wsargent wsargent 968975679 Oct 16 14:20 logger-3.log
Okay, so it's not that the encoder is the bottleneck. Instead, it appears to be the disk, and switching contexts between threads doesn't help the throughput. Let's write to tmpfs instead, using the default /dev/shm.
1 minute, 1 thread, one FILE appender /dev/shm/application.log = 8.5 GB:
-rw-rw-r-- 1 wsargent wsargent 9027620209 Oct 16 17:27 application.log
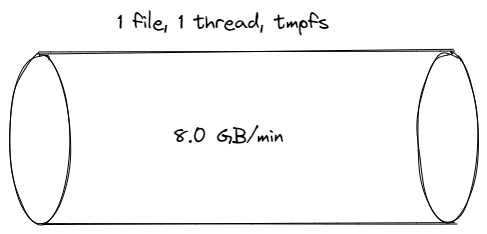
Ah-ha! That almost doubled the throughput!
Now lets see what happens if we add more threads, just to check.
1 minute, 2 threads, one FILE appender /dev/shm/application.log = 8.0 GB:
-rw-rw-r-- 1 wsargent wsargent 8563431350 Oct 16 18:06 application.log
Yep, that again reduces the throughput.
The message to take away from this is that if you want to maximize throughput, it's not a question of picking the right logging framework, or the right appender – you need to look at your bottlenecks.
Summary
- Use conditional guards and avoid creating objects or calling methods that may block (which may include
toString). - Use
logback-logstash-encoder, preferably with a listener so you can tell if the queue fills up. - Be careful of edge cases with compression and rollover.
- Usually the concern is too much throughput rather than too little.
- If you really need it, use
/dev/shmor Blacklite for your log storage.
Comments